Financial Statement Analysis Page 50
ADVERTISEMENT
 1
1 2
2 3
3 4
4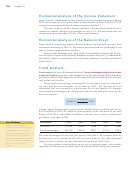 5
5 6
6 7
7 8
8 9
9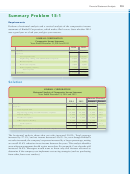 10
10 11
11 12
12 13
13 14
14 15
15 16
16 17
17 18
18 19
19 20
20 21
21 22
22 23
23 24
24 25
25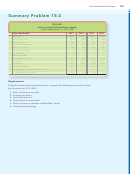 26
26 27
27 28
28 29
29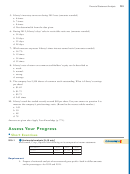 30
30 31
31 32
32 33
33 34
34 35
35 36
36 37
37 38
38 39
39 40
40 41
41 42
42 43
43 44
44 45
45 46
46 47
47 48
48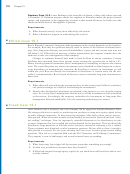 49
49 50
50 51
51Financial Statement Analysis
771
Financial Statement Case 15-1
Amazon.com’s financial statements in Appendix A at the end of this book reveal some interest-
ing relationships. Answer these questions about Amazon:
Requirements
1. Compute trend analyses for net sales and net income. Use 2007 as the base year. What is
the most notable aspect of this data?
2. Compute inventory turnover for 2009 and 2008. The inventory balance at December 31,
2009, was $2,171 million. Do the trend of net income from 2008 to 2009 and the
change in the rate of inventory turnover tell the same story or a different story? Explain
your answer.
Team Projects
Team Project 15-1 Select an industry you are interested in, and pick any company in that
industry to use as the benchmark. Then select two other companies in the same industry. For
each category of ratios in the Decision Guidelines in the chapter, compute all the ratios for the
three companies. Write a two-page report that compares the two companies with the bench-
mark company.
Team Project 15-2 Select a company and obtain its financial statements. Convert the
income statement and the balance sheet to common size, and compare the company you
selected to the industry average. The Risk Management Association’s Annual Statement
Studies, Dun & Bradstreet’s Industry Norms & Key Business Ratios, and Prentice Hall’s
Almanac of Business and Industrial Financial Ratios, by Leo Troy, publish common-size state-
ments for most industries.
Communication Activity 15-1
In 75 words or fewer, explain the difference between horizontal and vertical analysis. Be sure to
include in your answer how each might be used.
Quick Check Answers
1. b 2. a 3. d 4. c 5. a 6. b 7. d 8. c 9. a 10. b
For online homework, exercises, and problems that provide you
immediate feedback, please visit .
ADVERTISEMENT
0 votes
Related Articles
Related forms


Related Categories
Parent category: Financial