Taxes And Fees Administered By The California State Board Of Equalization 2005-2006 Page 2
ADVERTISEMENT
 1
1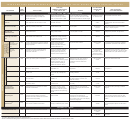 2
2TaxEs and FEEs adminisTErEd by ThE caliFornia sTaTE board oF EqualizaTion, 2005-06
WHO PAYS;
05–06 REVENUES/
YEAR
NUMBER OF REGISTRANTS
CHANGE FROM
FUND ALLOCATION—
TAX PROGRAM
STARTED
WHAT IS TAXED
AS OF JUNE 30, 2006
TAX RATE
04–05
HOW FUNDS ARE USED
spEcial TaxEs and FEEs (continued)
Use Fuel Tax
1937
Vehicular use of liquid natural gas,
Owners and operators of
6–18¢ per gallon of fuel (varies by
Included in revenue
Transportation Tax Fund, above
compressed natural gas (CNG), and
vehicles powered by covered
type), 7¢ per 100 cubic feet of CNG,
for diesel fuel tax
certain other fuels
fuels, use fuel vendors; 1,060
or annual fee based on vehicle weight
Motor Vehicle
2002
Gasoline, upon removal from the terminal
Gasoline suppliers; 119 suppliers,
18¢ per gallon
$2.87 billion
Transportation Tax Fund—to construct and
1
Fuel Tax
132 other accounts
rack, importation into the state, or sale
maintain public roads and mass transit
+0.34%
systems
Aircraft Jet Fuel Tax
1969
Sales of jet fuel to jet fuel users
Jet fuel dealers; 218
2¢ per gallon
$3.12 million
State Transportation Fund, Aeronautics
Account—airport programs
+21.35%
Underground
Owners of underground fuel
1989
Storage of petroleum products in
1.3¢ per gallon through 12/05
$241.57 million
Program that ensures cleanup of leaking
Storage Tank
underground tanks
storage tanks; 6,862
1.4¢ per gallon eff. 1/06
underground petroleum storage tanks
+10.82%
Maintenance Fee
Childhood Lead
1993
Motor vehicle fuel; architectural coatings;
The petroleum industry, the
Reestablished each reporting period
$9.97 million
Lead poisoning prevention program
Poisoning Prevention
lead releases into California air
architectural coatings industry,
for children
−16.24%
Fee
and facilities reporting releases
of lead into the air; 941
Oil Spill
Marine pipeline operators;
1991
Crude oil and petroleum products received
5¢ per barrel eff.1-20-03
$28.76 million
Oil spill prevention programs and studies
Prevention and
at marine terminals in California or moved
owners of crude oil and
of spill effects, prevention, and response
+4.37%
Administration
through pipelines
petroleum products received
Fee
at marine terminals; 33
Oil Spill
1991
Petroleum products received at marine
Owners of petroleum products
25¢ per barrel
No fees collected
Oil Spill Response Trust Fund—pays for
Response
received at marine terminals,
terminals, moved through pipelines, or
in 2005–06;
response to and cleanup of marine oil spills;
Fee
received at refineries
marine pipeline operators, oil
$50 million Oil Spill
related wildlife care; spill-related damages
refineries, marine pipelines; 28
Response Trust
Fund is at maximum
Environmental Fee
1989
Activity by certain types of corporations
Corporations with at least
$250–$11,952 per year, based on
$31.70 million
Cleanup of contaminated sites
50 employees, in industry groups
number of workers employed in
+3.42%
that use, generate, store, or
California more than 500 hours
conduct activities relating to
annually
hazardous materials; 42,581
Activity Fee
1989
Applications and modification requests for
Hazardous waste activity
Varies according to activity
$0.71 million
Regulation of hazardous waste
hazardous waste permits
applicants; n/a
requested
management
+56.80%
Generator Fee
1986
Generation of hazardous waste at a
Generators of hazardous waste
$177–$70,660, based on amount of
$22.46 million
See above
specific site
who do not pay a facility fee;
waste generated
−3.13%
6,578
Disposal Fee
Hazardous waste disposed of by depositing
Hazardous waste disposal
1985
Rates per ton vary, depending
$6.58 million
See above
on or into land
facilities; 10
on waste category, volume, and
+11.47%
disposal method
Facility Fee
1986
Storage, treatment, or disposal of
Hazardous waste facility
Varies according to size and type
$4.75 million
See above
operators; 217
hazardous waste
of facility
−7.12%
Occupational
Industrial activity by employers in certain
Employers with 10 or more
1991
$258–$2,958 per year, based on
$3.09 million
Occupational lead poisoning prevention
Lead Poisoning
industrial classifications
employees in industries with
number of employees and industrial
program
+3.21%
Prevention Fee
documented evidence of poten-
classification
tial occupational lead poisoning;
16,530
Electronic Waste
Certain new or refurbished televisions,
Retailers of new or refurbished
This fee ranges from $6.00 to $10.00
$78.32 million
The fee was established to fund electronic
2005
Recycling Fee
computer monitors, laptop computers,
CEDs; 20,000
imposed on the retail sale to
waste recycling programs and over time,
+154.24%
and other devices (referred to as Covered
consumers. The fee is based upon
reduce the amount of hazardous waste in
Electronic Devices (CEDs))
the viewable size of the video display,
landfills
measured diagonally.
Marine Invasive
Ships entering California with ballast water
Owners and operators of vessels
$3.00 million
Program that addresses the introduction of
$400 per qualifying vessel voyage
2000
Species Fee
from outside a defined coastal zone
arriving in California ports; 3,039
non-native aquatic species into the state’s
2
−14.80%
waters
p r o p E r T y T a x E s
Private Railroad Car Tax
1938
Private railcars operated within California
Railcar owners; 239
1.092% of assessed value
General Fund
$6.95 million
+5.68%
Timber Yield Tax
1977
Timber harvested for forest products
Timber owners; 1,989
2.9% of immediate harvest value
$16.14 million
Distributed to counties where timber was
harvested
+13.16%
Originally the Motor Vehicle Fuel License Tax, implemented in 1941.
1
Known as the Ballast Water Management Fee through December 31, 2003. Administered under the Marine Invasive Species Fee Collection Law, effective January 1, 2004.
2
ADVERTISEMENT
0 votes
Related Articles
Related forms
 - California State Board Of Equalization")


Related Categories
Parent category: Financial