Survey Methodology #2006-02 - Use Of Dependent Interviewing Procedures To Improve Data Quality In The Measurement Of Change - U.s. Census Bureau Page 13
ADVERTISEMENT
 1
1 2
2 3
3 4
4 5
5 6
6 7
7 8
8 9
9 10
10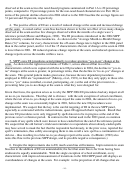 11
11 12
12 13
13 14
14 15
15 16
16 17
17 18
18 19
19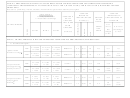 20
20 21
21 22
22 23
23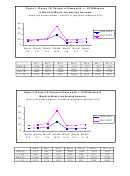 24
24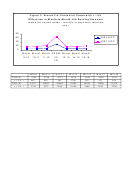 25
25in a non-monthly fashion, and to limit our analysis to those who reported individual pay period
3
amounts
or monthly totals.
Our analysis of seam effects uses an arbitrary definition of an amount “change” – namely, a
4
difference in earnings amounts between two adjacent months of plus or minus 5 percent
. Here
again we analyze each pair of waves separately, focusing on the proportion of cases that fell
outside the 5% threshold for each month-pair in waves 1-2, 2-3, and 3-4. We restrict the analysis
sample to those interviewed in each wave of the pair who held the same job in each wave, and
who provided an income amount for each month. Figures 1, 2, and 3, which summarize the
results of our analysis of seam bias for earnings amounts in waves 1-2, 2-3, and 3-4, respectively,
offer stark visual evidence that DI significantly reduced the “spike” of differences between
monthly earnings reported for the same job across the interview seam. Figure 1, for example,
shows that almost 70 percent of earnings amounts reportedly changed (according to our
definition) across the wave 1-2 seam in 2001, compared to about half that rate in 2004, when DI
was made available as a nonresponse follow-up procedure. Note also that when DI was not
available in either panel, in the three month-pairs within wave 1, the line graphs are virtually
identical, with a constant change rate of about 20 percent. After the seam spike in 2001, the
picture within wave 2 returns to a pattern almost identical to that of wave 1 – a change rate that is
fairly constant at about 19 percent – in contrast to the post-seam change rates in 2004, which are
only about half the rates observed in the earlier panel. Figures 2 and 3 present strikingly similar
results. In all three analyses the percent of cases falling outside the threshold at the seam is
5
significantly lower in the 2004 panel than it was in 2001, in some cases reduced by over half
,
and the change rate for off-seam month-pairs (with the exception of those in wave 1) is also
consistently lower in the 2004 panel compared to 2001.
The magnitude of the DI procedures’ impact on change at the seam is surprisingly large, given
that their intended use is restricted to a quite set of circumstances,. It appears, however, that
intended use and actual use may have been very different matters. We find, for example, that the
DI follow-up questions were invoked over half the time in waves 2 and 3 when asking about job
6
earnings, and about 40 percent of the time when asking about business earnings
. These rates far
exceed typical rates of nonresponse to earnings amount items (Moore, Stinson, and Welniak,
3
We further restricted those reporting pay period amounts in the 2004 panel to those reporting pay amounts that
varied. We excluded those reporting paychecks that did not vary because the new instrument systematically
suppressed month-to-month variation when it aggregated to monthly amounts.
4
Kalton and Miller (1991) use this definition of change to study seam bias in the 1984 SIPP panel for Social
Security payment amounts. They find a large seam effect, consisting of almost nonexistent month-to-month change
within a single wave, contrasted with amount change at the seam about two-thirds of the time.
5
Waves 1-2: 69.5% vs. 37.8%, t=47.2, p<.001; Waves 2-3: 69.1% vs. 31.0%, t=52.2, p<.001; Waves 3-4: 66.4%
vs. 30.1%, t=50.6, p<.001.
6
Unfortunately, we cannot determine which condition (same as last time, don’t know, or refused) prompted the DI
screens to come up most often. For some reporting options, the original amount entry was overwritten when
dependent data was later presented and verified as correct. In these cases it is impossible to distinguish whether a DI
screen was invoked due to the “same as last time” “don’t know” or “refused” trigger.
-12-
ADVERTISEMENT
0 votes
Related Articles
Related forms
 Survey Methodology #2012-02 - New Relationship And Marital Questions: A Reflection Of Changes To The Social And Legal Recognition Of Same-sex Couples In The U.s. - U.s. Census Bureau
Legal
Survey Methodology #2012-02 - New Relationship And Marital Questions: A Reflection Of Changes To The Social And Legal Recognition Of Same-sex Couples In The U.s. - U.s. Census Bureau
Legal
 - Consolidated Bas - U.s. Census Bureau")


 Early Childhood Program Participation, From The National Household Education Surveys Program Of 2012 - U.s. Department Of Education
Legal
Early Childhood Program Participation, From The National Household Education Surveys Program Of 2012 - U.s. Department Of Education
Legal
 Form Hud-9887 And 9887-a - Document Pachagefor Applicant's/tenant's Concent To The Release Of Information - U.s. Department Of Housing And Urban Development
Legal
Form Hud-9887 And 9887-a - Document Pachagefor Applicant's/tenant's Concent To The Release Of Information - U.s. Department Of Housing And Urban Development
Legal


Related Categories
Parent category: Legal