Survey Methodology #2006-02 - Use Of Dependent Interviewing Procedures To Improve Data Quality In The Measurement Of Change - U.s. Census Bureau Page 21
ADVERTISEMENT
 1
1 2
2 3
3 4
4 5
5 6
6 7
7 8
8 9
9 10
10 11
11 12
12 13
13 14
14 15
15 16
16 17
17 18
18 19
19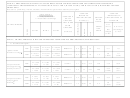 20
20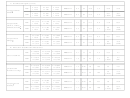 21
21 22
22 23
23 24
24 25
25A. Need-Based Programs (cont’d)
n = 575
n = 534
n = 479
2001
55.5%***
8.4
4.4
32.6
7.4
29.0
52.8
ª = 345
ª = 326
ª = 267
receipt of AFDC/
2/
TANF
n = 835
n = 786
n = 734
18.1
38.1
2004
36.3%***
8.3
6.2
21.2
3.4
ª = 499
ª = 461
ª = 416
(-38%)
(-28%)
n = 1,172
n = 1,130
n = 1,147
2001
52.7%***
5.9
3.3
21.7
6.6
17.0
68.3
ª = 546
ª = 436
ª = 443
receipt of WIC
(Women, Infants,
2/
n = 1,713
n = 1,703
n = 1,667
9.0
49.0
Children) benefits
2004
34.6%***
5.5
4.2
13.3
3.2
ª = 672
ª = 648
ª = 635
(-47%)
(-28%)
n = 2,104
n = 2,033
n = 2,008
2001
52.2%***
6.2
3.5
22.7
6.5
18.1
62.7
ª = 976
ª = 884
ª = 823
receipt of Food
2/
Stamps
n = 3,844
n = 3,837
n = 3,802
9.2
47.9
2004
34.4%***
5.4
4.1
13.0
3.2
ª = 1,512
ª = 1,435
ª = 1,377
(-49%)
(-24%)
B. Other (Non-Need-Based) Characteristics
n = 50,948
n = 47,458
n = 46,920
2001
28.9%***
2.1
1.7
4.3
2.5
23.3
2.1
ª = 6,188
ª = 9,629
ª = 5,086
school enrollment
n = 73,919
n = 67,729
n = 65,758
8.7
2.1
2004
17.7%***
1.9
1.8
2.7
1.5
ª = 8,082
ª = 13,549
ª = 6,189
(-63%)
(0%)
n = 51,378
n = 47,856
n = 47,064
2001
73.4%***
1.5
0.46
7.6
16.5
5.4
14.1
ª = 5,607
ª = 4,971
ª = 4,616
private health
insurance coverage
n = 78,162
n = 73,217
n = 71,128
3.2
11.3
2004
62.8%***
1.2
0.53
5.4
10.2
ª = 6,483
ª = 6,627
ª = 5,991
(-41%)
(-20%)
n = 9,929
n = 9,569
n = 9,442
2001
79.4%***
1.1
0.26
6.0
23.1
3.8
92.8
ª = 780
ª = 753
ª = 655
receipt of Social
2/
Security
n = 14,999
n = 14,610
n = 14,403
3.0
87.3
2004
62.2%***
1.3
0.55
5.5
10.0
ª = 1,321
ª = 1,378
ª = 1,173
(-21%)
(-6%)
ADVERTISEMENT
0 votes
Related Articles
Related forms
 Survey Methodology #2012-02 - New Relationship And Marital Questions: A Reflection Of Changes To The Social And Legal Recognition Of Same-sex Couples In The U.s. - U.s. Census Bureau
Legal
Survey Methodology #2012-02 - New Relationship And Marital Questions: A Reflection Of Changes To The Social And Legal Recognition Of Same-sex Couples In The U.s. - U.s. Census Bureau
Legal
 - Consolidated Bas - U.s. Census Bureau")


 Early Childhood Program Participation, From The National Household Education Surveys Program Of 2012 - U.s. Department Of Education
Legal
Early Childhood Program Participation, From The National Household Education Surveys Program Of 2012 - U.s. Department Of Education
Legal
 Form Hud-9887 And 9887-a - Document Pachagefor Applicant's/tenant's Concent To The Release Of Information - U.s. Department Of Housing And Urban Development
Legal
Form Hud-9887 And 9887-a - Document Pachagefor Applicant's/tenant's Concent To The Release Of Information - U.s. Department Of Housing And Urban Development
Legal


Related Categories
Parent category: Legal