Selected Current Economic Indicators For Nebraska - Department Of Economic Development
ADVERTISEMENT
 1
1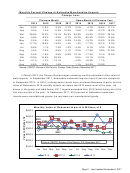 2
2 3
3 4
4 5
5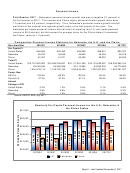 6
6 7
7 8
8SELECTED CURRENT ECONOMIC INDICATORS FOR
NEBRASKA
by
Research Staff
Nebraska Department of Economic Development
The following graphs and tables provide monthly values for selected Nebraska
economic indicators. Because of differences in release dates and revisions of
preliminary estimates, some numbers are more “current” than others.
Monthly Value of Nebraska Exports and Imports
September – The U.S. Census Bureau reported that Nebraska’s September 2017 exports
were down 8.8 percent compared to August 2017, but were up 13.9 percent compared to
September 2016 (see graph and table below). Nebraska’s 2016 exports ran below their 2014
levels for every month of the year, finishing 19.0 percent less than the 2014 total. The state’s
2017 exports started out the year above their 2016 totals, but have not exceeded their 2014
levels for most months of the year. The Census Bureau reported that 81.4 percent of
Nebraska’s September exports were manufactured goods; 14.7 percent were non-
manufactured goods; and the rest were re-exports.
Monthly Value of Nebraska Exports (in millions of $), 2014 to
2017
$900.0
$800.0
$665
$620 $604 $613 $603 $622
$700.0
$550
$500
$567
$600.0
$500.0
$400.0
$300.0
Source: USDOC, Bureau of the Census, ITA, 2017
$200.0
$100.0
$0.0
Jan
Feb
Mar
Apr
May
Jun
Jul
Aug
Sep
Oct
Nov
Dec
2014
2015
2016
2017
Page 1 – Last Updated November 8, 2017
ADVERTISEMENT
0 votes
Related Articles
Related forms
 Agreement - Nebraska Department Of Revenue") Nebraska Income Tax E-file Electronic Return Originator (ero) Agreement - Nebraska Department Of Revenue
Financial
Nebraska Income Tax E-file Electronic Return Originator (ero) Agreement - Nebraska Department Of Revenue
Financial


 Instructions For Nebraska And City Sales And Use Tax Return Sheet - Nebraska Department Of Revenue
Financial
Instructions For Nebraska And City Sales And Use Tax Return Sheet - Nebraska Department Of Revenue
Financial
 Instructions For Form 10 - Nebraska And Local Sales And Use Tax Return - Nebraska Department Of Revenue
Financial
Instructions For Form 10 - Nebraska And Local Sales And Use Tax Return - Nebraska Department Of Revenue
Financial
 Adjustment Form 11a For Nebraska Combined Tax Report/wage Report - Nebraska Department Of Labor
Legal
Adjustment Form 11a For Nebraska Combined Tax Report/wage Report - Nebraska Department Of Labor
Legal


Related Categories
Parent category: Legal