Selected Current Economic Indicators For Nebraska - Department Of Economic Development Page 7
ADVERTISEMENT
 1
1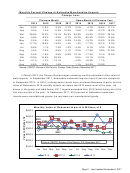 2
2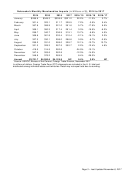 3
3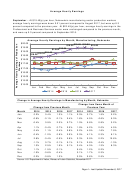 4
4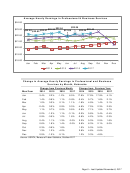 5
5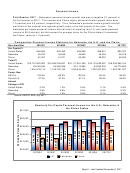 6
6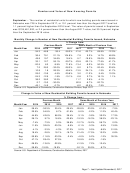 7
7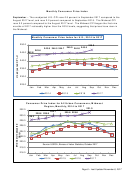 8
8Number and Value of New Housing Permits
September – The number of residential units for which new building permits were issued in
Nebraska was 728 in September 2017, or 10.1 percent less than the August 2017 level but
1.1 percent higher than the September 2016 level. The value of permits issued in September
was $139,481,000, or 2.4 percent lower than the August 2017 value, but 35.3 percent higher
than the September 2016 value.
Monthly Change in Number of New Residential Building Permits Issued, Nebraska
% Change from:
Previous Month
Same Month of Previous Year
Month/Year
2014
2015
2016
2017
2014
2015
2016
2017
Jan
-34.3
-46.6
-35.4
-38.3%
-21.6
-23.7%
69.8%
-12.0%
Feb
36.4
79.1
21.1%
104.8%
-7.9
0.2%
14.7%
48.9%
Mar
49.8
19.7
34.6%
16.4%
-5.7
-19.9%
29.0%
28.8%
Apr
33.1
12.7
55.1%
-29.7%
-23.9
-32.1%
77.5%
-41.7%
May
-20.5
6.3
-9.9%
71.8%
-13.4
-9.2%
50.3%
11.2%
Jun
7.2
28.3
-32.0%
-26.3%
-9.2
8.7%
-20.4%
20.6%
Jul
-10.8
1.8
26.3%
48.4%
-13.5
24.1%
-1.3%
41.7%
Aug
25.0
-10.5
-4.5%
-25.6%
3.0
-11.2%
5.4%
10.3%
Sep
-24.3
-12.5
-1.9%
-10.1%
-0.8
2.7%
18.1%
1.1%
Oct
38.2
38.2
12.2%
11.7
2.6%
-4.1%
Nov
-3.7
-15.3
-30.0%
82.9
-9.7%
-20.7%
Dec
-45.1
-14.5
-0.7%
-6.2
40.5%
-7.9%
Source: U.S. Department of Commerce, Construction Statistics Division, Sept. 2017
Change in Value of New Residential Building Permits Issued in Nebraska
% Change from:
Previous Month
Same Month of Previous Year
Month/Year
2014
2015
2016
2017
2014
2015
2016
2017
Jan
-36.4%
-36.3%
35.4%
-25.4%
-28.8%
-23.9%
61.5%
-7.5%
Feb
20.5%
54.9%
6.7%
61.9%
-5.0%
-2.2%
11.2%
40.4%
Mar
44.9%
42.6%
66.9%
39.4%
-3.1%
-3.8%
30.2%
17.3%
Apr
26.1%
9.7%
16.6%
-23.6%
-19.3%
-16.3%
38.3%
-23.1%
May
-7.4%
-7.3%
5.0%
36.8%
-10.7%
-16.2%
56.7%
0.2%
Jun
11.5%
32.6%
-20.3%
-9.5%
-0.1%
-0.3%
-5.9%
13.9%
Jul
-4.1%
-3.3%
-4.3%
27.2%
5.2%
0.5%
-6.9%
51.5%
Aug
18.4%
-2.8%
18.1%
-16.7%
21.4%
-17.5%
13.2%
6.8%
Sep
-30.8%
-11.8%
-23.0%
-2.4%
-4.0%
5.2%
-1.2%
35.3%
Oct
47.1%
28.4%
27.5%
18.9%
-8.2%
-1.9%
Nov
-26.0%
-13.6%
-22.8%
41.3%
7.2%
-12.4%
Dec
-38.6%
-19.9%
-16.5%
-24.1%
39.9%
-8.7%
Source: U.S. Department of Commerce, Construction Statistics Division, 2017
Page 7 – Last Updated November 8, 2017
ADVERTISEMENT
0 votes
Related Articles
Related forms
 Agreement - Nebraska Department Of Revenue") Nebraska Income Tax E-file Electronic Return Originator (ero) Agreement - Nebraska Department Of Revenue
Financial
Nebraska Income Tax E-file Electronic Return Originator (ero) Agreement - Nebraska Department Of Revenue
Financial


 Instructions For Nebraska And City Sales And Use Tax Return Sheet - Nebraska Department Of Revenue
Financial
Instructions For Nebraska And City Sales And Use Tax Return Sheet - Nebraska Department Of Revenue
Financial
 Instructions For Form 10 - Nebraska And Local Sales And Use Tax Return - Nebraska Department Of Revenue
Financial
Instructions For Form 10 - Nebraska And Local Sales And Use Tax Return - Nebraska Department Of Revenue
Financial
 Adjustment Form 11a For Nebraska Combined Tax Report/wage Report - Nebraska Department Of Labor
Legal
Adjustment Form 11a For Nebraska Combined Tax Report/wage Report - Nebraska Department Of Labor
Legal


Related Categories
Parent category: Legal