Exponentially Weighted Moving Average Chart Page 3
ADVERTISEMENT
 1
1 2
2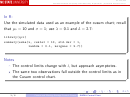 3
3 4
4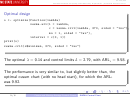 5
5 6
6 7
7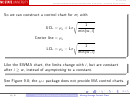 8
8ST 435/535
Statistical Methods for Quality and Productivity Improvement / Statistical Process Control
In R:
Use the simulated data used as an example of the cusum chart; recall
that
= 10 and
= 1; use
= 0 1 and L = 2 7:
0
library(qcc)
summary(ewma(x, center = 10, std.dev = 1,
lambda = 0.1, nsigmas = 2.7))
Notes
The control limits change with i, but approach asymptotes.
The same two observations fall outside the control limits as in
the Cusum control chart.
3 / 8
Cusum and Moving Average Control Charts
EWMA Control Chart
ADVERTISEMENT
0 votes
Related Articles
Related forms


Related Categories
Parent category: Business