Exponentially Weighted Moving Average Chart Page 4
ADVERTISEMENT
 1
1 2
2 3
3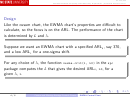 4
4 5
5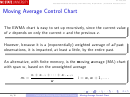 6
6 7
7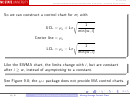 8
8ST 435/535
Statistical Methods for Quality and Productivity Improvement / Statistical Process Control
Design
Like the cusum chart, the EWMA chart’s properties are difficult to
calculate, so the focus is on the ARL. The performance of the chart
is determined by L and .
Suppose we want an EWMA chart with a specified ARL
, say 370,
0
and a low ARL
for a one-sigma shift.
1
For any choice of , the function
in the
xewma.crit(l, L0)
spc
package computes the L that gives the desired ARL
,
, for a
L0
0
given ,
.
l
4 / 8
Cusum and Moving Average Control Charts
EWMA Control Chart
ADVERTISEMENT
0 votes
Related Articles
Related forms


Related Categories
Parent category: Business