Exponentially Weighted Moving Average Chart Page 8
ADVERTISEMENT
 1
1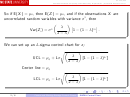 2
2 3
3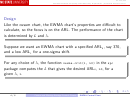 4
4 5
5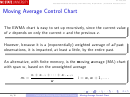 6
6 7
7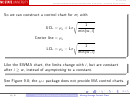 8
8ST 435/535
Statistical Methods for Quality and Productivity Improvement / Statistical Process Control
So we can construct a control chart for m with
1
UCL =
+ L
0
min(w i)
Center line =
0
1
LCL =
L
0
min(w i)
Like the EWMA chart, the limits change with i, but are constant
after i
w , instead of asymptoting to a constant.
See Figure 9.8; the
package does not provide MA control charts.
qcc
8 / 8
Cusum and Moving Average Control Charts
Moving Average Control Chart
ADVERTISEMENT
0 votes
Related Articles
Related forms


Related Categories
Parent category: Business