Exponentially Weighted Moving Average Chart Page 5
ADVERTISEMENT
 1
1 2
2 3
3 4
4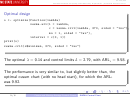 5
5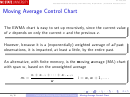 6
6 7
7 8
8ST 435/535
Statistical Methods for Quality and Productivity Improvement / Statistical Process Control
Optimal design
o <- optimize(function(lambda)
xewma.arl(l = lambda,
c = xewma.crit(lambda, 370, sided = "two"),
mu = 1, sided = "two"),
interval = c(0, 1))
print(o)
xewma.crit(o$minimum, 370, sided = "two")
The optimal
= 0 14 and control limits L = 2 79, with ARL
= 9 58.
1
The performance is very similar to, but slightly better than, the
optimal cusum chart (with no head start), for which the ARL
1
was 9.92.
5 / 8
Cusum and Moving Average Control Charts
EWMA Control Chart
ADVERTISEMENT
0 votes
Related Articles
Related forms


Related Categories
Parent category: Business