Statistics Worksheet Page 2
ADVERTISEMENT
 1
1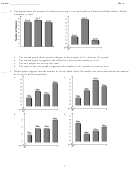 2
2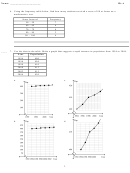 3
3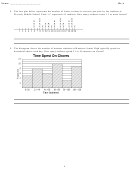 4
4 5
5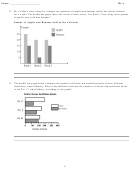 6
6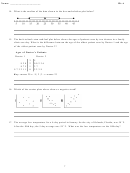 7
7 8
8 9
9Name: ______________________
ID: A
____
4. The graphs show the number of students receiving A’s in each grade at Glenwood Middle School. Which
statement is true?
a.
The second graph shows greater changes in the number of A’s than the first graph.
b.
The second graph exaggerates the differences between the numbers of A’s.
c.
The two graphs are exactly the same.
d.
The scale of the first graph exaggerates the number of A’s because it starts at zero.
____
5. Which graph suggests that the number of sit-ups Mark did in November was more than double the number
of sit-ups he did in September?
a.
c.
b.
d.
2
ADVERTISEMENT
0 votes
Related Articles
Related forms


Related Categories
Parent category: Education