Statistics Worksheet Page 7
ADVERTISEMENT
 1
1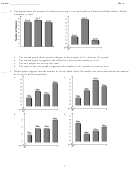 2
2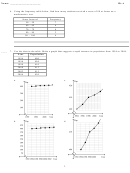 3
3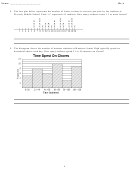 4
4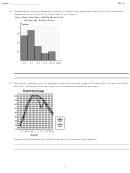 5
5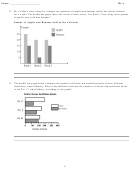 6
6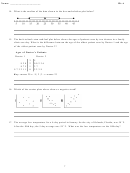 7
7 8
8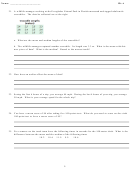 9
9Name: ______________________
ID: A
14. What is the median of the data shown in the box-and-whisker plot below?
15. The back-to-back stem-and-leaf plot below shows the ages of patients seen by two doctors in a family
clinic one day. What is the difference between the age of the oldest patient seen by Doctor 1 and the age
of the oldest patient seen by Doctor 2?
Ages of Doctor’s Patients
Doctor 1
Doctor 2
3
5
9 2 0
2
0 0 2 3 6
8 7 5
1
3 7
9 7 3 2 1 1
0
2 2 3 9
Key: means 29 ← 9 | 2 | 3 → means 23
16. Which of the scatter plots above shows a negative trend?
o
17. The average low temperature for a 4-day period in January for the city of Orlando, Florida, was 58
F.
o
After the fifth day, the 5-day average was 59
F. What was the low temperature on the fifth day?
7
ADVERTISEMENT
0 votes
Related Articles
Related forms


Related Categories
Parent category: Education