Statistics Worksheet Page 3
ADVERTISEMENT
 1
1 2
2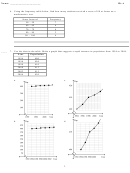 3
3 4
4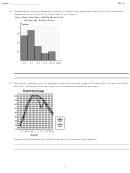 5
5 6
6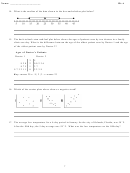 7
7 8
8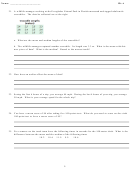 9
9Name: ______________________
ID: A
6. Using the frequency table below, find how many students received a score of 80 or better on a
mathematics test.
Score Interval
Frequency
50 – 59
7
60 – 69
6
70 – 79
6
80 – 89
3
90 – 100
4
____
7. Use the data in the table. Make a graph that suggests a rapid increase in population from 1994 to 2004.
Year
Population
1994
400
1996
404
1998
410
2000
412
2002
415
2004
420
a.
c.
b.
d.
3
ADVERTISEMENT
0 votes
Related Articles
Related forms


Related Categories
Parent category: Education