Statistics Worksheet Page 6
ADVERTISEMENT
 1
1 2
2 3
3 4
4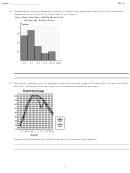 5
5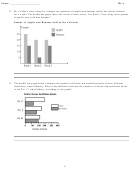 6
6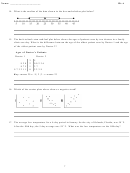 7
7 8
8 9
9Name: ______________________
ID: A
12. Mr. Collins’s class wanted to compare the quantities of apples and bananas sold at the school cafeteria
for 3 weeks. The double bar graph shows the results of their survey. For Week 2, how many more pounds
of apples were sold than bananas?
Pounds of Apples and Bananas Sold at the Cafeteria
13. The double bar graph below compares the numbers of fiction and nonfiction books at three different
elementary school libraries. What is the difference between the numbers of fiction and nonfiction books
in the P.S. 17 school library, according to the graph?
6
ADVERTISEMENT
0 votes
Related Articles
Related forms


Related Categories
Parent category: Education