5-4 Analyzing Graphs Of Polynomial Functions Worksheet With Answers Page 10
ADVERTISEMENT
 1
1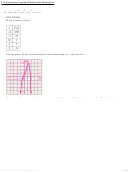 2
2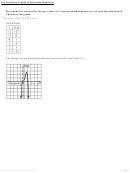 3
3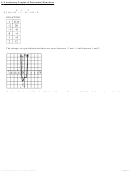 4
4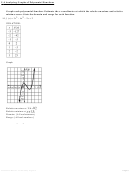 5
5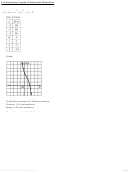 6
6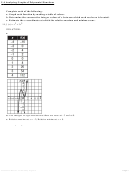 7
7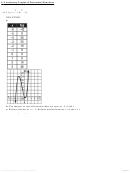 8
8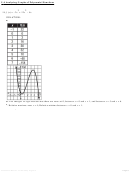 9
9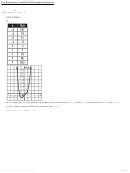 10
10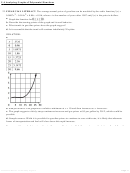 11
11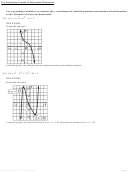 12
12 13
13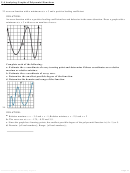 14
14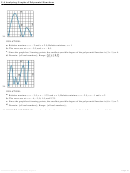 15
15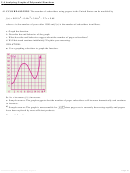 16
16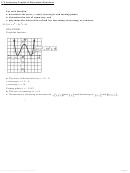 17
17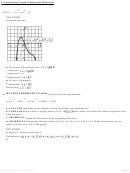 18
18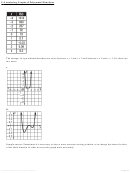 19
19 20
20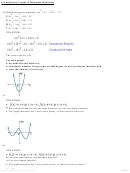 21
21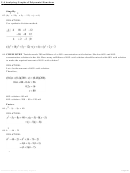 22
22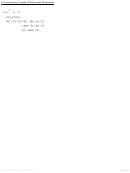 23
23b. The changes in sign indicate that there are zeros at 0, between x = 0 and x = 1, and between x = 5 and x = 6.
5-4 Analyzing Graphs of Polynomial Functions
c . Relative maxima: near x = 4; Relative minima between x = 0 and x = 1.
4
20. f (x) = x
+ 2x – 1
SOLUTION:
a.
b. The changes in sign indicate that there are zeros between x = –2 and x = –1 and between x = 0 and x = 1.
c. No relative maxima; Relative minima: near x = –1
22. FINANCIAL LITERACY The average annual price of gasoline can be modeled by the cubic function f (x) =
3
2
– 0.014x
0.0007x
+ 0.08x + 0.96, where x is the number of years after 1987 and f (x) is the price in dollars.
a. Graph the function for
.
b. Describe the turning points of the graph and its end behavior.
c. What trends in gasoline prices does the graph suggest?
d. Is it reasonable that the trend will continue indefinitely? Explain.
SOLUTION:
a.
eSolutions Manual - Powered by Cognero
Page 10
ADVERTISEMENT
0 votes
Related Articles
Related forms


Related Categories
Parent category: Education