5-4 Analyzing Graphs Of Polynomial Functions Worksheet With Answers Page 4
ADVERTISEMENT
 1
1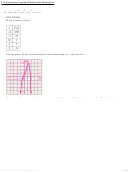 2
2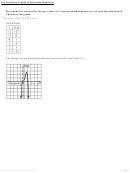 3
3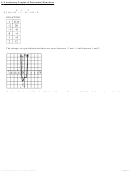 4
4 5
5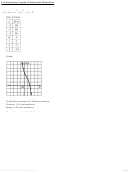 6
6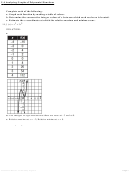 7
7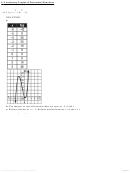 8
8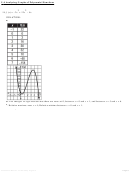 9
9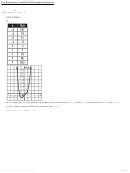 10
10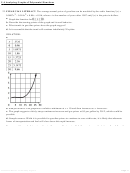 11
11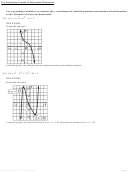 12
12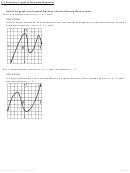 13
13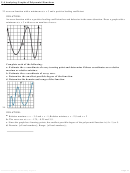 14
14 15
15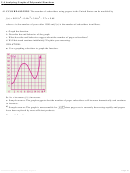 16
16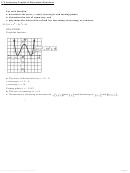 17
17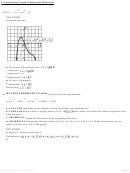 18
18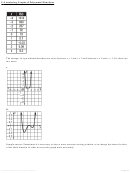 19
19 20
20 21
21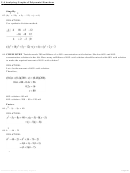 22
22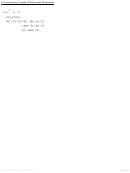 23
235-4 Analyzing Graphs of Polynomial Functions
4
3
2
8. f (x) = 2x
– x
– 3x
+ 2x – 4
SOLUTION:
The changes in sign indicate that there are zeros between –2 and –1 and between 1 and 2.
Graph each polynomial function. Estimate the x-coordinates at which the relative maxima and relative
minima occur. State the domain and range for each function.
3
2
10. f (x) = 3x
– 6x
– 2x + 2
SOLUTION:
Graph:
eSolutions Manual - Powered by Cognero
Page 4
ADVERTISEMENT
0 votes
Related Articles
Related forms


Related Categories
Parent category: Education