5-4 Analyzing Graphs Of Polynomial Functions Worksheet With Answers Page 18
ADVERTISEMENT
 1
1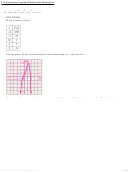 2
2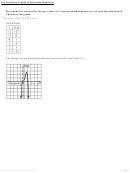 3
3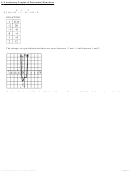 4
4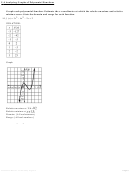 5
5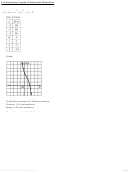 6
6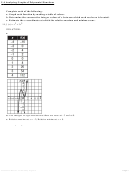 7
7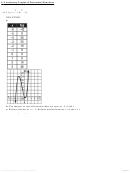 8
8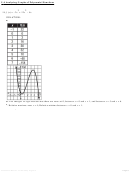 9
9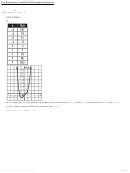 10
10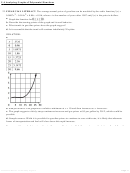 11
11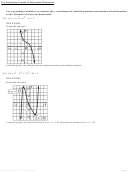 12
12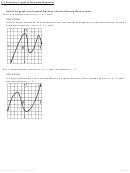 13
13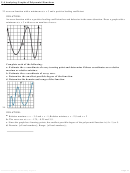 14
14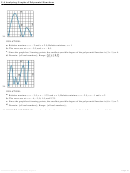 15
15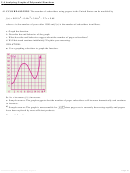 16
16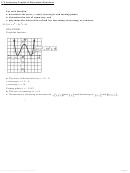 17
17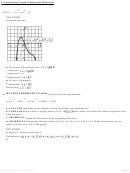 18
18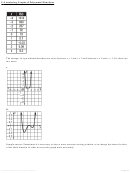 19
19 20
20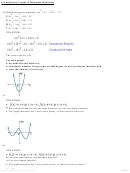 21
21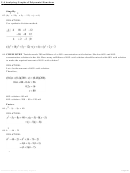 22
22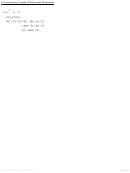 23
23y-intercept: y = 16
Turning points: x = –2, 0, 2
b. The axis of symmetry is x = 0.
5-4 Analyzing Graphs of Polynomial Functions
c . The function is increasing in the intervals
and
and decreasing in
and
4
3
44. f (x) = –2x
+ 4x
– 5x
SOLUTION:
Graph the function.
a. The zeros of the function are:
.
x-intercepts:
;
y-intercept: y = 0;
Turning point:
;
b. No axis of symmetry.
c. Increasing:
Decreasing:
46. MULTIPLE REPRESENTATIONS Consider the following function.
4
3
2
f (x) = x
– 8.65x
+ 27.34x
– 37.2285x + 18.27
a. ANALYTICAL What are the degree, leading coefficient, and end behavior?
b. TABULAR Make a table of integer values f (x) if
How many zeros does the function appear to have
from the table?
c . GRAPHICAL Graph the function by using a graphing calculator.
d . GRAPHICAL Change the viewing window to [0, 4] scl: 1 by [–0.4, 0.4] scl: 0.2. What conclusions can you
make from this new view of the graph?
SOLUTION:
a. degree: 4; leading coefficient: 1;
End behavior:
b.
eSolutions Manual - Powered by Cognero
Page 18
ADVERTISEMENT
0 votes
Related Articles
Related forms


Related Categories
Parent category: Education