5-4 Analyzing Graphs Of Polynomial Functions Worksheet With Answers Page 12
ADVERTISEMENT
 1
1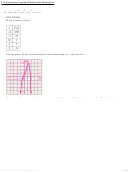 2
2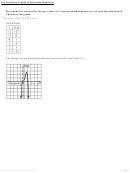 3
3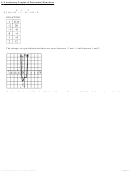 4
4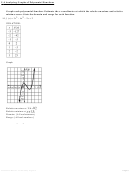 5
5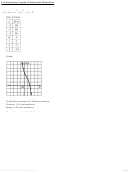 6
6 7
7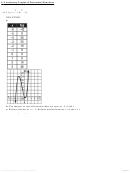 8
8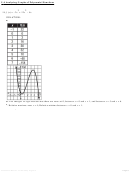 9
9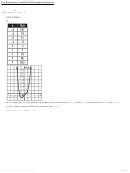 10
10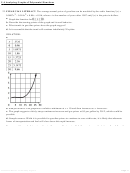 11
11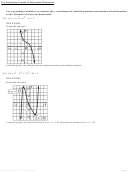 12
12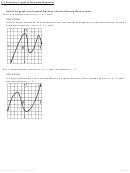 13
13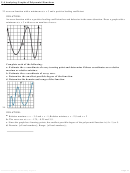 14
14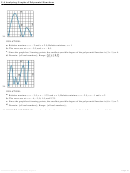 15
15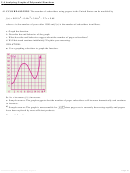 16
16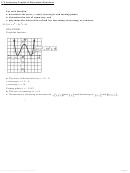 17
17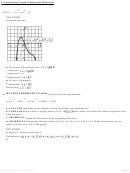 18
18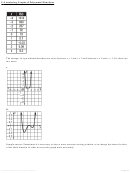 19
19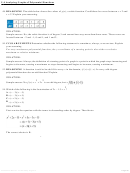 20
20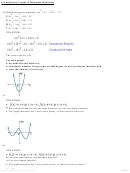 21
21 22
22 23
23b . Sample answer: The graph has a relative minimum at x = 10 and then increases as x increases.
c. The graph suggests a fairly steep continuous increase and gas prices at $5 per gallon by 2012, which could be
possible.
d. Sample answer: While it is possible for gasoline prices to continue to soar at this rate, it is likely that alternate
5-4 Analyzing Graphs of Polynomial Functions
forms of transportation and fuel will slow down this rapid increase.
Use a graphing calculator to estimate the x-coordinates at which the maxima and minima of each function
occur. Round to the nearest hundredth.
3
2
24. f (x) = –2x
+ 4x
– 5x + 8
SOLUTION:
Graph the function.
From the graph, the function has no relative maxima and relative minima.
5
3
2
26. f (x) = x
– 4x
+ 3x
– 8x – 6
SOLUTION:
Graph the function.
From the graph, the relative maxima is at x = –1.87 and relative minima is at x = 1. 52.
Sketch the graph of polynomial functions with the following characteristics.
28. an even function with zeros at –2, 1, 3, and 5
SOLUTION:
An even-degree function has an even number of real zeros and the end behavior is in the same direction. So draw a
graph that crosses the x-axis at -2, 1, 3, and 5.
eSolutions Manual - Powered by Cognero
Page 12
ADVERTISEMENT
0 votes
Related Articles
Related forms


Related Categories
Parent category: Education