Mixed Math Worksheets With Answer Key Page 2
ADVERTISEMENT
 1
1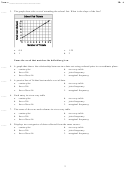 2
2 3
3 4
4 5
5 6
6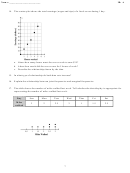 7
7 8
8 9
9 10
10Name: ________________________
ID: A
____
3. The graph shows the cost of attending the school fair. What is the slope of the line?
a.
0.8
c.
1.25
b.
1
d.
2
Name the word that matches the definition given.
____
4. A graph that shows the relationship between two data sets using ordered pairs in a coordinate plane.
a.
scatter plot
d.
two-way table
b.
line of fit
e.
joint frequency
c.
line of best fit
f.
marginal frequency
____
5. A precise line of fit that best models a set of data.
a.
scatter plot
d.
two-way table
b.
line of fit
e.
joint frequency
c.
line of best fit
f.
marginal frequency
____
6. Each entry in a two-way table
a.
scatter plot
d.
two-way table
b.
line of fit
e.
joint frequency
c.
line of best fit
f.
marginal frequency
____
7. The sums of the rows and columns in a two-way table.
a.
scatter plot
d.
two-way table
b.
line of fit
e.
joint frequency
c.
line of best fit
f.
marginal frequency
____
8. Displays two categories of data collected from the same source.
a.
scatter plot
d.
two-way table
b.
line of fit
e.
joint frequency
c.
line of best fit
f.
marginal frequency
2
ADVERTISEMENT
0 votes
Related Articles
Related forms


Related Categories
Parent category: Education