Mixed Math Worksheets With Answer Key Page 6
ADVERTISEMENT
 1
1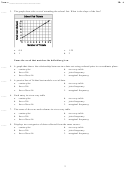 2
2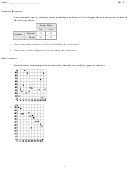 3
3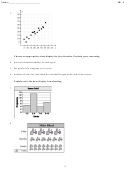 4
4 5
5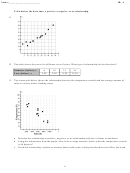 6
6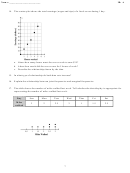 7
7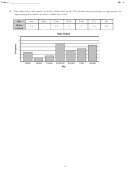 8
8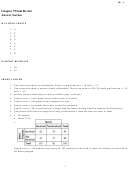 9
9 10
10Name: ________________________
ID: A
Tell whether the data show a positive, a negative, or no relationship.
11.
12. The table shows the prices for different sizes of pizza. What type of relationship do the data show?
6
10
12
16
Diameter (inches), x
Cost (dollars), y
3.99
9.99
11.99
15.99
13. The scatter plot below shows the relationship between the temperature outside and the average amount of
sales at various winter clothing stores.
a. Describe the relationship as positive, negative, or no relationship and also as linear or nonlinear.
b. Using the information from the graph, what is the average amount of sales when the temperature outside
is 60 degrees?
c. Given the relationship, explain an instance that would create a data point that does not follow the trend.
6
ADVERTISEMENT
0 votes
Related Articles
Related forms


Related Categories
Parent category: Education