Mixed Math Worksheets With Answer Key Page 4
ADVERTISEMENT
 1
1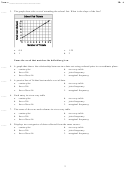 2
2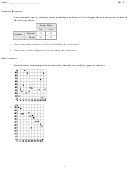 3
3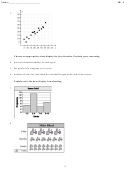 4
4 5
5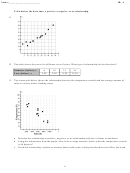 6
6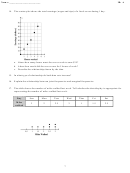 7
7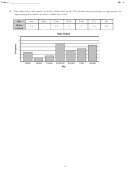 8
8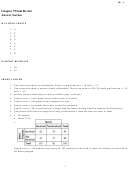 9
9 10
10Name: ________________________
ID: A
3.
Choose an appropriate data display for the situation. Explain your reasoning.
4. percent of student athletes in each sport
5. the profits of a company over a year
6. number of wins for each team in a baseball league at the end of the season
Explain why the data display is misleading.
7.
8.
4
ADVERTISEMENT
0 votes
Related Articles
Related forms


Related Categories
Parent category: Education