Mixed Math Worksheets With Answer Key Page 7
ADVERTISEMENT
 1
1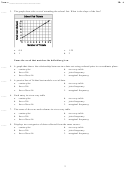 2
2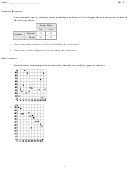 3
3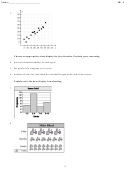 4
4 5
5 6
6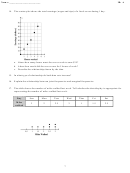 7
7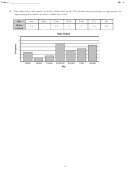 8
8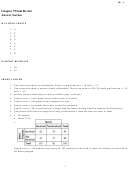 9
9 10
10Name: ________________________
ID: A
14. The scatter plot shows the total earnings (wages and tips) of a food server during 1 day.
a. About how many hours must the server work to earn $35?
b. About how much did the server earn for 5 hours of work?
c. Describe the relationship shown by the data.
15. In what type of relationship do both data sets increase?
16. Explain the relationship between joint frequencies and marginal frequencies.
17. The table shows the number of miles walked last week. Tell whether the data display is appropriate for
representing the number of miles walked last week.
Day
Sun
Mon
Tues
Wed
Thur
Fri
Sat
Miles
3
2
2.5
3
1
1.5
2.5
walked
7
ADVERTISEMENT
0 votes
Related Articles
Related forms


Related Categories
Parent category: Education