Mixed Math Worksheets With Answer Key Page 9
ADVERTISEMENT
 1
1 2
2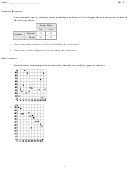 3
3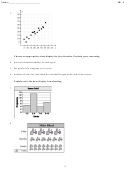 4
4 5
5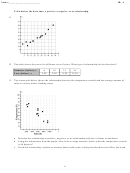 6
6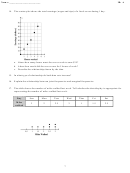 7
7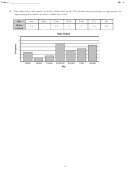 8
8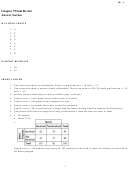 9
9 10
10ID: A
Chapter 9 Final Review
Answer Section
MULTIPLE CHOICE
1. A
2. C
3. C
4. A
5. C
6. E
7. F
8. D
NUMERIC RESPONSE
1. 40
2. 42
SHORT ANSWER
1. The scatter plot shows no relationship. There is a gap between x = 10 and x = 15.
2. The scatter plot shows a negative linear relationship. There is an outlier at (24, 20) and a gap between x = 10
and x = 20.
3. positive linear relationship; no obvious outliers, gaps, or clusters
4. Sample answer: circle graph; shows data as parts of a whole
5. Sample answer: line graph; shows changes over time
6. Sample answer: bar graph; shows data in specific categories
7. Sample answer: The second interval is larger than the others, making it hard to compare the frequencies.
8. The picture of the bikes are larger on Friday, which makes it seem like there are more of them.
9. a. 34 students
b. about 37.8%
c.
Sample answer: 164 students were surveyed. 103 students are involved in sports. 96 students are involved in
the music program.
1
ADVERTISEMENT
0 votes
Related Articles
Related forms


Related Categories
Parent category: Education