Mixed Math Worksheets With Answer Key Page 5
ADVERTISEMENT
 1
1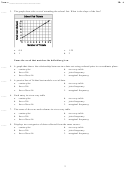 2
2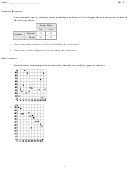 3
3 4
4 5
5 6
6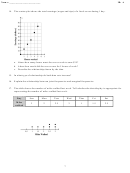 7
7 8
8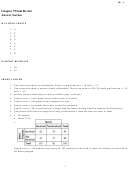 9
9 10
10Name: ________________________
ID: A
9. You randomly survey students about their involvement in school sports and the school music program. The
two-way table shows the results.
a. How many students are involved in the school music program but not school sports?
b. What percent of students are involved in both school sports and the school music program?
c. Find and interpret the marginal frequencies for the survey.
10. The scatter plot shows the numbers of hybrid vehicles sold in a city from 2009 to 2014.
a. In what year were 400 hybrid vehicles sold?
b. About how many hybrid vehicles were sold in 2012?
c. Describe the relationship shown by the data.
5
ADVERTISEMENT
0 votes
Related Articles
Related forms


Related Categories
Parent category: Education