Pie Chart Worksheet - Vidya Guru Karol Bagh Page 3
ADVERTISEMENT
 1
1 2
2 3
3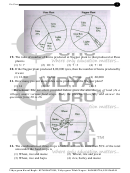 4
4 5
5 6
6Pie-Chart
3
14. The increase in the number of Clerical workers in the workforce of country X
from 1981 to 1995 (in millions) is
(1) 0.5
(2) 1.25
(3) 0.75
(4) 1.5
15. The percentage decrease in the number of Blue-Collar workers in the workforce
of country X from 1981 to 1995 is
2
1
(1) 20
(2) 16
(3) 42
(4) 35
3
2
16. In 1981, the number of service workers in the workforce, in millions, was
(1) 22.5
(2) 28.0
(3) 15.0
(4) 20.5
17. In 1981, then number of categories which comprised of more than 25 million
workers each, is
(1) four
(2) five
(3) two
(4) three
18. The ratio of the number of worker of workers in the Professional category in 1981
to the number of such workers in 1995 is
(1) 9 : 14
(2) 14 : 9
(3) 4 : 9
(4) 5 : 14
Directions: The pie charts, given here show some automobile parts manufactured
by an automobile company at its Pune and Nagpur plants in the years 2009. Study
the pie charts and answer questions number 19 to 21 based
Vidya guru Karol Bagh - 8376934679/81, Vidya guru Tilak Nagar - 9654899726, 9311566241
ADVERTISEMENT
0 votes
Related Articles
Related forms


Related Categories
Parent category: Education