Pie Chart Worksheet - Vidya Guru Karol Bagh Page 6
ADVERTISEMENT
 1
1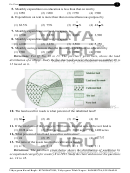 2
2 3
3 4
4 5
5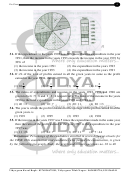 6
66
Pie-Chart
31. If the expenditure in the years 1993 was 30% more than the expenditure in the year
1991, then the income in the years 1993 exceeds the income in the year 1991 by
30% of
(1) the income in the years 1991
(2) the expenditure in the years 1993
(3) the income in the year 1993
(4) the expenditure in the years 1991
32. If x% of the total of profits earned in all the given years in same as the profit
earned in the year 1994, then x is
2
1
2
1
(1) 16
(2) 33
(3) 12
(4) 11
3
3
3
2
33. The ratios of expenditures and incomes in the years 1992, 1994 and 1996 are
given to be 6 : 5 : 8 and 2 : 3 : 4 respectively. The ratio of the income in the years
1996 to the total expenditure in the years 1992 and 1994 is
(1) 40 : 11
(2) 10 : 7
(3) 20 : 11
(4) 20 : 13
34. The year is which the profit is nearest to the average of the profits carned in al the
given years. is
(1) 1991
(2) 1995
(3) 1993
(4) 1994
35. If the income in the years 1997 was 5 times the expenditure made in the same year,
then the ratio of the profit earned in the year 1991 to the expenditure in the year
1997 was
(1) 11 : 28
(2) 44 : 7
(3) 28 : 11
(4) 7 : 44
Directions: Percentage of the candidates enrolled in seven different schools for
the CBSE 10th examination and candidates who passed the examination, is given
by the following pie-graph. Study the graph and answer questions no. 36 to 40
Vidya guru Karol Bagh - 8376934679/81, Vidya guru Tilak Nagar - 9654899726, 9311566241
ADVERTISEMENT
0 votes
Related Articles
Related forms


Related Categories
Parent category: Education