Scatter Plots And Trend Lines Page 2
ADVERTISEMENT
 1
1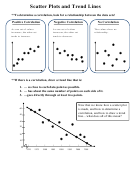 2
2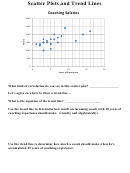 3
3 4
4Scatter Plots and Trend Lines
**To determine a correlation, look for a relationship between the data sets!
Positive Correlation
Negative Correlation
No Correlation
As one set of values
As one set of values
The values show no
increases, the other set
increases, the other set
relationship.
tends to increase.
tends to decrease.
**If there is a correlation, draw a trend line that is:
1. … as close to each data point as possible.
2. … has about the same number of points on each side of it.
3. …goes directly through at least two points.
Now that we know how a scatter plot
60
is made, and how to determine a
correlation, and how to draw a trend
50
line…what does all of this mean?
40
30
20
10
|
|
|
|
|
|
|
|
0
1970
1975
1980
1985
1990
1995
2000
2005
ADVERTISEMENT
0 votes
Related Articles
Related forms


Related Categories
Parent category: Business