Scatter Plots And Trend Lines Page 4
ADVERTISEMENT
 1
1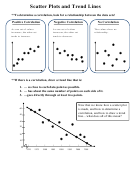 2
2 3
3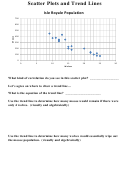 4
4Scatter Plots and Trend Lines
Isle Royale Population
700
600
500
400
300
200
100
0
0
5
10
15
20
25
30
Wolves
What kind of correlation do you see in this scatter plot? _________________
Let’s agree on where to draw a trend line…
What is the equation of the trend line? _____________________
Use the trend line to determine how many moose would remain if there were
only 4 wolves. (visually and algebraically)
Use the trend line to determine how many wolves would essentially wipe out
the moose population. (visually and algebraically)
ADVERTISEMENT
0 votes
Related Articles
Related forms


Related Categories
Parent category: Business