Cdc Who Growth Charts Page 5
ADVERTISEMENT
 1
1 2
2 3
3 4
4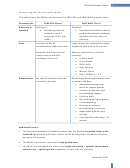 5
5 6
6 7
7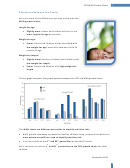 8
8 9
9 10
10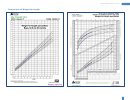 11
11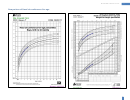 12
12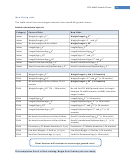 13
13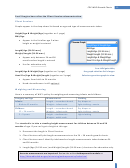 14
14 15
15 16
16 17
17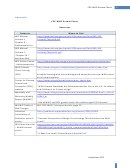 18
18 19
19 20
20CDC-WHO Growth Charts
4
Comparing the two Growth Charts
This table shows the differences between the 2000 CDC and 2006 WHO growth charts.
Characteristic
2000 CDC Charts
2006 WHO Charts
Reference or
Reference:
Standard:
Standard
Describes growth of
Describes how children should
children in the U.S.
grow under optimal conditions
during the 1970’s and
regardless of time, place, or
1980’s.
ethnicity.
Data
Limited number of
Large number of measurements taken
measurements taken less often.
frequently from birth to 24 months.
Based on data from national
Based on data taken in six world
health surveys and birth
locations:
certificates in the U.S.
Pelotas, Brazil
Accra, Ghana
Delhi, India
Oslo, Norway
Muscat, Oman
Davis, California – U.S.
Requirements
No special requirements to be
Had to meet these requirements to be
included in the data.
included in the data:
Adequate socioeconomic
status to support growth
Access to health care and
breastfeeding support
Full term birth
No smoking during pregnancy
or breastfeeding
Exclusive or primarily
breastfeeding > 4 months
Began feeding solids by 6
months
Continued breastfeeding > 12
months
Additional factors:
The American Academy of Pediatrics states that the healthy breastfed infant is the
standard against which all other infants should be compared. The WHO charts are
based on this premise.
The WHO charts were created with high quality data.
The WHO charts support the theory that optimal nutrition + optimal environment +
optimal care = optimal growth regardless of time, place or ethnicity.
September 2012
ADVERTISEMENT
0 votes
Related Articles
Related forms

")
")


Related Categories
Parent category: Life