Cdc Who Growth Charts Page 6
ADVERTISEMENT
 1
1 2
2 3
3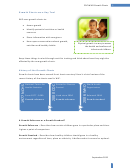 4
4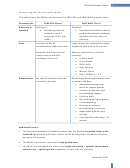 5
5 6
6 7
7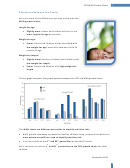 8
8 9
9 10
10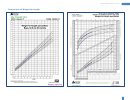 11
11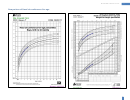 12
12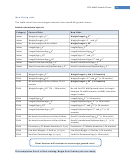 13
13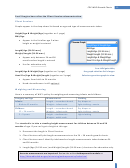 14
14 15
15 16
16 17
17 18
18 19
19 20
20CDC-WHO Growth Charts
5
The WHO Hypothesis
Children throughout the world will grow similarly if exposed to optimal circumstances.
This chart shows the birth to 24 months growth data from the 6 WHO countries.
“For the first time, we now have a technically robust tool to measure,
monitor and evaluate the growth of all children worldwide, regardless of
ethnicity, socioeconomic status or type of feeding.”
WHO Committee Member
Recommendation to Use the WHO Growth Charts
The Center for Disease Control (CDC), the National Institutes of Health (NIH), and the
American Academy of Pediatrics (AAP) recommend using the WHO growth charts for
children birth to 24 months in the United States.
USDA accepts the recommendation for WIC.
Washington WIC will use these growth charts:
WHO growth charts for children 0 – 24 months of age
Length/Age & Weight/Age, Weight/Length & Head Circumference/Age
CDC growth charts for children 2 – 5 years old
Height/Age & Weight/Age and BMI/Age
CDC weight/length and length/age charts for children 24 - 36 months who can’t
be measured standing up. These charts are for education only.
September 2012
ADVERTISEMENT
0 votes
Related Articles
Related forms

")
")


Related Categories
Parent category: Life