Cdc Who Growth Charts Page 8
ADVERTISEMENT
 1
1 2
2 3
3 4
4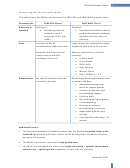 5
5 6
6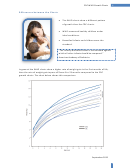 7
7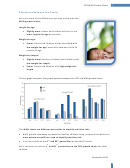 8
8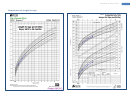 9
9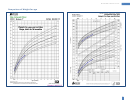 10
10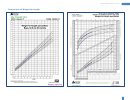 11
11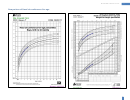 12
12 13
13 14
14 15
15 16
16 17
17 18
18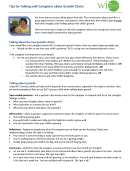 19
19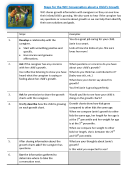 20
20CDC-WHO Growth Charts
7
Differences between the Charts
Here are some of the differences you may notice with the
WHO growth charts:
Length-for-age:
Slightly more infants and children will plot in the
lower length-for-age percentiles.
Weight-for-age:
Fewer infants and children will be identified with
low weight-for-age, especially between 6 and 23
months of age.
Weight-for-length:
Slightly lower number of infants and children with
low weight-for-length.
Fewer infants and children with high weight-for-
length.
This bar graph compares the growth patterns between the CDC and WHO growth charts.
The WHO charts use different percentiles to identify nutrition risks.
WHO growth standards are based on healthy children living in optimal conditions so
more extreme cutoffs are used to identify nutrition risk.
Use new cutoffs at the 2
nd
th
and 98
percentiles on the WHO charts.
th
th
We’ll continue to use the 5
and 95
percentiles on the CDC growth charts for older
children
.
September 2012
ADVERTISEMENT
0 votes
Related Articles
Related forms

")
")


Related Categories
Parent category: Life