Cdc Who Growth Charts Page 7
ADVERTISEMENT
 1
1 2
2 3
3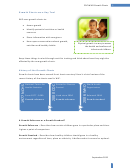 4
4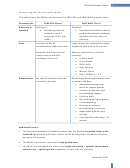 5
5 6
6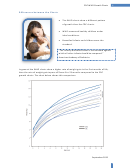 7
7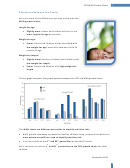 8
8 9
9 10
10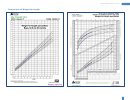 11
11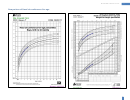 12
12 13
13 14
14 15
15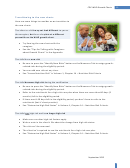 16
16 17
17 18
18 19
19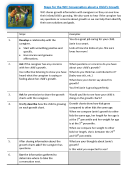 20
20CDC-WHO Growth Charts
6
Differences between the Charts
The WHO charts show a different pattern
of growth than the CDC charts.
WHO measured healthy children under
ideal conditions.
Breastfed infants and children were the
standard.
“The healthy breastfed infant is the standard against
which all other infants should be compared.”
American Academy of Pediatrics
In general the WHO charts show a higher rate of weight gain in the first months of life,
then the rate of weight gain tapers off from 6 to 23 months compared to the CDC
growth charts. The chart below shows this comparison.
September 2012
ADVERTISEMENT
0 votes
Related Articles
Related forms

")
")


Related Categories
Parent category: Life