Acute Ischemic Stroke : Infarct Core Estimation On Ct Angiography Source Images Depends On Ct Angiography Protocol Page 5
ADVERTISEMENT
 1
1 2
2 3
3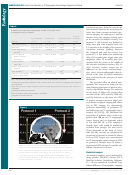 4
4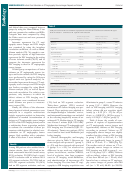 5
5 6
6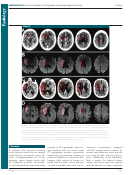 7
7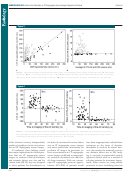 8
8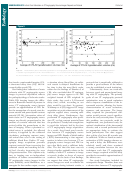 9
9 10
10 11
11 12
12NEURORADIOLOGY:
Infarct Core Estimation on CT Angiography Source Images Depends on Protocol
Pulli et al
Table 3
and clinical data were compared between
groups by using the Mann-Whitney U test
Comparison of Clinical and Demographic Characteristics between Patients Imaged
and were presented as medians and IQRs.
with Protocol 1 and Those Imaged with Protocol 2
Categoric data were compared by using
Patients Imaged with
Patients Imaged with
the Fisher exact test and were presented
Characteristic
Protocol 1 ( n = 35)
Protocol 2 ( n = 65)
P Value
as percentages.
Interrater agreement for CT angi-
†
Age (y) *
71 (60.3–78.0)
73 (56.8–81.0)
.621
ography source images and DW images
‡
Male sex
15 (42.9)
29 (44.6)
. .99
was examined by using the intraclass
†
NIHSSS *
15 (9–21)
16 (13.75–20.25)
.230
correlation coeffi cient, as well as Bland-
‡
Right-side involvement
15 (42.9)
28 (43.1)
. .99
Altman analysis ( 25 ). We sought to con-
‡
Atrial fi brillation
9 (25.7)
12 (18.5)
.445
‡
Level of occlusion
.733
fi rm previous reports of high interrater
Proximal ICA
1 (2.9)
2 (3.1)
agreement for DW imaging in the setting
Terminal ICA (with or without
10 (28.6)
19 (29.2)
of acute ischemic stroke ( 26,27 ) and to
extension into MCA M1)
compare the interrater agreement for
MCA M1
17 (48.6)
36 (55.4)
DW imaging to that for CT angiography
MCA M2
7 (20.0)
7 (10.8)
source images.
MCA M3
0
1 (1.5)
Within-group comparisons of lesion
†
Time to imaging (h:min) *
4:07 (2:47–5:39)
4:00 (2:31–4:59)
.370
volumes on CT angiography source im-
†
Time from CT angiography to MR
0:40 (0:35–1:04)
0:27 (0:19–0:37)
, .0001
ages and lesion volumes at DW imaging
imaging (h:min) *
were performed by using the Wilcoxon
‡
Received intravenous tPA before
10 (28.6)
23 (35.4)
.514
signed rank test (paired analysis). In-
imaging
termethod agreement between CT angi-
ography source images and DW images
Note.—Unless otherwise indicated, data are numbers of patients, with percentages in parentheses. NIHSSS = National Institutes
of Health Stroke Scale Score.
was further examined by using Bland-
* Data are medians, with IQRs in parentheses.
Altman analysis ( 25 ), as well as Spear-
†
Calculated with the Mann-Whitney U test.
man rank correlation. For relative com-
‡
Calculated with the Fisher exact test.
parisons, only instances in which the
infarct volume at DW imaging was 5
mL or greater were considered because
small volumes are prone to measure-
(1%) had an M3 segment occlusion.
40 minutes in group 1, versus 27 minutes
ment errors ( 28 ).
Thirty-three patients (33%) received
in group 2 ( P , .0001). However, the
Finally, the effects of the aforemen-
intravenous tPA before imaging was per-
time to MR imaging and DW imaging
tioned protocol-related parameters were
formed. These patients were admitted to
infarct volume did not correlate signif-
analyzed in a stepwise multivariate
the hospital through a “telestroke” service,
icantly ( r = 0.13 [ P = .17] for all pa-
tients, r = 0.008 [ P = .96] for group 1,
logistic regression analysis to determine
and intracranial hemorrhage was excluded
predictors of marked overestimation of
at the referring hospital by means of un-
and r = 0.28 [ P = .82] for group 2).
lesions on CT angiography source images
enhanced CT. Median time to CT imaging
Table 4 shows the results of com-
( 20% of the DW imaging lesion) and in
was 4 hours 1 minute (IQR, 2:36–5:04).
parison of regions of hypoattenuation
a multivariate linear regression analysis
Median time between CT angiography and
on CT angiography source images and
to evaluate the correlation of these pa-
DW imaging was 31 minutes (IQR, 22–
hyperintensity volumes at DW imaging
rameters with absolute (or relative) over-
41 minutes). Twenty-one patients (21%)
according to protocol. Volume on CT
estimation on CT angiography source
were found to have atrial fi brillation just
angiography source images was slightly
images. Only variables with a univariate
before imaging.
smaller than the volume at DW imaging
P value of less than .1 were included.
Clinical, demographic, and imaging
in group 1 (33.0 vs 41.6 mL, P = .01)
data are given in Table 3 . Between pa-
but was signifi cantly larger in group 2
tients imaged with protocol 1 (group 1;
(94.8 vs 17.8 mL, P 5 .0001 [ Fig 2 ]).
Results
n = 35) and those imaged with protocol
The median ratio of volume on CT an-
Among 100 patients who satisfi ed the in-
2 (group 2; n = 65), we observed no
giography source images to volume at
clusion criteria, three (3%) had an iso-
difference in age, male sex, right hemi-
DW imaging was 0.83 in group 1, ver-
lated extracranial internal carotid artery
sphere involvement, median NIHSSS,
sus 3.5 in group 2 ( P , .0001). Patients
(ICA) occlusion, 29 (29%) had a termi-
level of occlusion, time from symptom
with an infarct volume at DW imaging
nal ICA occlusion with or without MCA
onset to CT imaging, atrial fi brillation,
of less than 100 mL (or , 70 mL) were
M1 segment occlusion, 53 (53%) had an
and administration of intravenous tPA
found to have a volume on CT angiogra-
MCA M1 segment occlusion, 14 (14%)
before imaging. The time from CT angi-
phy source images of greater than 100
had an M2 segment occlusion, and one
ography to MR imaging acquisition was
mL (or . 70 mL) 44.4% (or 59.6%)
597
Radiology: Volume 262: Number 2—February 2012
n
ADVERTISEMENT
0 votes
Related Articles
Related forms


 - State Of Connecticut Human Resources")


Related Categories
Parent category: Medical