Acute Ischemic Stroke : Infarct Core Estimation On Ct Angiography Source Images Depends On Ct Angiography Protocol Page 6
ADVERTISEMENT
 1
1 2
2 3
3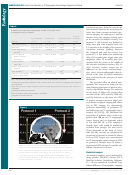 4
4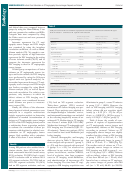 5
5 6
6 7
7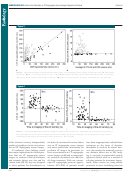 8
8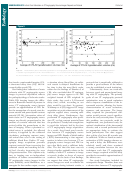 9
9 10
10 11
11 12
12NEURORADIOLOGY:
Infarct Core Estimation on CT Angiography Source Images Depends on Protocol
Pulli et al
Table 4
CI: 18.2, 11007 ) were independent
predictors of marked overestimation
Imaging Characteristics of Patients Imaged with Protocol 1 and Those Imaged with
( Table 2 ). This was also confi rmed by
Protocol 2
multivariate linear regression analysis
Imaging Characteristic
Protocol 1 ( n = 35)
Protocol 2 ( n = 65)
P Value
(Table E1 [online]), where a negative
correlation was found between time
†
‡
Volume of hyperintense region
41.6 (18.8–133.2) *
17.8 (10.3–41.9)
.002
to imaging of the anterior circulation
at DW imaging (mL)
territory and both absolute difference
‡
Volume of hypoattenuating
33.0 (14.6–105.4)
94.8 (55.9–134.7)
.002
and ratio between infarct volume on
region on CT angiography
CT angiography source images and
source images (mL)
‡
Ratio of volume on CT
0.83 (0.54–1.0)
3.5 (1.6–7.4)
, .0001
that on DW images (coeffi cients,
angiography source images
2 2.39 6 0.30 [standard deviation]
to that on DW images
and 2 0.138 6 0.02, respectively; P
‡
Volume on CT angiography
2 9.9 ( 2 26.7 To 4.4)
54.4 (27.4–96.7)
, .0001
, .001). The presence of atrial fi bril-
source images minus
lation correlated positively with both
volume on DW images (mL)
absolute difference and ratio between
||
Overestimation of volume at
3/31 (9.7)
56/62 (90.3)
, .0001
infarct volume on CT angiography
DW imaging by
source images and that on DW im-
§
20% or greater
ages (coeffi cients, 30.49 6 11.1 and
||
CT angiography source image
0/24 And 0/21
28/63 (44.4) And
, .0001 And , .0001
2.24 6 0.92, respectively; P , .02).
hypoattenuation volume greater
34/57 (59.6)
Finally, a time of 38 seconds to imag-
than 100 mL (or > 70 mL) with
ing of the middle of the anterior cir-
DW imaging volume less than
culation territory demonstrated good
§#
100 mL (or < 70 mL)
discrimination between good and poor
Note.—Unless otherwise specifi ed, data are medians, with IQRs in parentheses.
agreement between infarct volume on
* P = .01 (Wilcoxon signed rank test ) for comparison with volume on CT angiography source images.
CT angiography source images and
†
P , .0001 (Wilcoxon signed rank test) with volume on CT angiography source images.
that on DW images ( Fig 4 ).
‡
Calculated with the Mann-Whitney U test.
The intraclass correlation coeffi -
§
Data are numbers of patients, with percentages in parentheses.
cient for CT angiography source im-
||
Calculated with the Fisher exact test.
ages in protocol 1 was 0.998 (95% CI:
#
In patients with a DW imaging volume of less than 100 mL (or , 70 mL).
0.995, 0.999), while it was 0.958 (95%
CI: 0.882, 0.980) for protocol 2 ( P ,
.0001). In Bland-Altman analysis ( Fig 5 )
of the time in group 2, but no such
overestimation
on
CT
angiography
for protocol 1, reader 1 underestimated
overestimation was observed in group 1
source images, there were statistically
infarct volume on CT angiography source
( P , .0001). Finally, volume at DW
signifi cant differences in table speed,
images by a mean of 2.1 mL compared
imaging was overestimated by at least
delay time, imaging direction (cranio-
with reader 2 (limits of agreement [95%
20% in 90.3% of patients in group 2,
caudal vs caudocranial), time to imag-
CI for differences]: 6.7, 2 11.0 mL).
versus in 9.7% of patients in group 1
ing of the anterior circulation territory,
For protocol 2, the mean difference
( P , .0001).
contrast material volume, contrast ma-
between reader 1 and 2 was 2 7.9 mL
The correlation between CT angiog-
terial injection duration, and time from
(limits of agreement: 16.7, 2 32.4 mL).
CT angiography to DW imaging ( P ,
Both mean differences and limits of
raphy source images and DW images was
signifi cantly stronger for group 1 than
.001 for all; Table 2 ). In general, image
agreement were signifi cantly different
for group 2 ( r = 0.91 vs 0.49, P , .001
acquisition was already completed with
between the two CT angiography pro-
tocols ( P , .001).
[ Fig 3a ]). At Bland-Altman analysis
protocol 2 before it had even started
( Fig 3b ), the mean ratio of infarct vol-
with protocol 1.
The intraclass correlation coeffi -
ume on CT angiography source images to
Although atrial fi brillation was not a
cient for DW imaging in group 1 was
volume at DW imaging was 0.82 (limits
predictor of marked overestimation for
0.996 (95% CI: 0.992, 0.998), while
of agreement: 0.18,1.46) for group 1. In
the entire cohort ( P = .289), it was pre-
it was 0.995 (95% CI: 0.991, 0.997)
contrast, the mean ratio for group 2 was
dictive in patients imaged with protocol
for group 2 ( P . .05). Bland-Altman
5.0 (limits of agreement: 2 2.9,12.9). Both
1 ( P = .008), in which a fi xed delay was
analysis (Fig E1 [online]) demonstrated
the means and the limits of agreement
used. In multivariate logistic regression,
good agreement between reader 1 and
were signifi cantly different between the
a shorter time to imaging of the anterior
reader 2 for both groups, with mean
protocols ( P , .0001).
circulation territory (odds ratio: 0.80;
differences and limits of agreement sim-
Between patients with and those
95% CI: 0.74, 0.88) and the presence of
ilar to those for CT angiography source
without marked ( 20%) infarct volume
atrial fi brillation (odds ratio: 447; 95%
images obtained with protocol 1.
598
Radiology: Volume 262: Number 2—February 2012
n
ADVERTISEMENT
0 votes
Related Articles
Related forms


 - State Of Connecticut Human Resources")


Related Categories
Parent category: Medical