Fourth Quarter 1999 Index Of Charts - Office Of Thrift Supervision - U.s. Department Of Treasury Page 10
ADVERTISEMENT
 1
1 2
2 3
3 4
4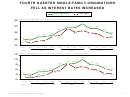 5
5 6
6 7
7 8
8 9
9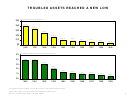 10
10 11
11 12
12 13
13 14
14 15
15 16
16 17
17 18
18TROUBLED ASSETS REACHED A NEW LOW
Troubled Assets ($ Billions)
$50
$ 39.1
$40
$ 33.9
$30
$ 24.7
$20
$ 16.7
$ 10.9
$ 9.5
$ 8.7
$10
$ 7.7
$ 6.3
$ 5.4
$0
1990
1991
1992
1993
1994
1995
1996
1997
1998
1999
Troubled Assets (Percent of Total Assets)
5%
4%
3.80%
3.79%
3.07%
3%
2.16%
2%
1.40%
1.24%
1.13%
0.99%
1%
0.77%
0.62%
0%
1990
1991
1992
1993
1994
1995
1996
1997
1998
1999
Troubled Assets include noncurrent loans and repossessed assets.
Data after 1995 are net of specific valuation allowances.
Office of Thrift Supervision / March 2000
9
ADVERTISEMENT
0 votes
Related Articles
Related forms
 Profitability For Ots-regulated Private-sector Thrift Institutions Guide - Office Of Thrift Supervision - U.s. Department Of Treasury - 1998
Legal
Profitability For Ots-regulated Private-sector Thrift Institutions Guide - Office Of Thrift Supervision - U.s. Department Of Treasury - 1998
Legal
 U.s. Department Of Justice Form Eoir-29 - Notice Of Appeal To The Board Of Immigration - Appeals From A Decision Of A Uscis Officer
Legal
U.s. Department Of Justice Form Eoir-29 - Notice Of Appeal To The Board Of Immigration - Appeals From A Decision Of A Uscis Officer
Legal


 Form 1041 - Fiduciary Return Of Income For Calendar Year 1933 - U.s. Department Of Treasury
Financial
Form 1041 - Fiduciary Return Of Income For Calendar Year 1933 - U.s. Department Of Treasury
Financial
 Ref Cpi And Index Ratios For January 2000 - Treasury Inflation-indexed Securities - U.s. Department Of The Treasury, Bureau Of The Fiscal Service
Legal
Ref Cpi And Index Ratios For January 2000 - Treasury Inflation-indexed Securities - U.s. Department Of The Treasury, Bureau Of The Fiscal Service
Legal
 G-20: Fact Sheet On Imf Reform - Office Of The Press Secretary - The White House - U.s. Department Of The Treasury - 2010
Legal
G-20: Fact Sheet On Imf Reform - Office Of The Press Secretary - The White House - U.s. Department Of The Treasury - 2010
Legal

 - Treasury Inspector General For Tax Administration - U.s. Department Of The Treasury")
Related Categories
Parent category: Legal