Fourth Quarter 1999 Index Of Charts - Office Of Thrift Supervision - U.s. Department Of Treasury Page 4
ADVERTISEMENT
 1
1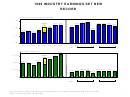 2
2 3
3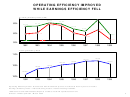 4
4 5
5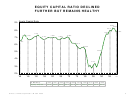 6
6 7
7 8
8 9
9 10
10 11
11 12
12 13
13 14
14 15
15 16
16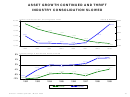 17
17 18
18OPERATING EFFICIENCY IMPROVED
WHILE EARNINGS EFFICIENCY FELL
Operating Efficiency Ratio (OER)
67.2%
65.8%
65.2%
65%
64.1%
64.0%
65.4%
62.7%
61.3%
62.0%
64.4%
60%
60.5%
59.8%
60.6%
60.0%
59.0%
57.2%
OER
OER - Including Gains o n A s s e t s H e ld fo r S a le
55%
1992
1993
1994
1995
1996
1997
1998
1999
Earnings Efficiency Ratio
110%
1 0 7 .2 %
1 0 7 .1 %
1 0 5 .9 %
1 0 5 .9 %
1 0 5 .4 %
105%
1 0 4 .2 %
1 0 3 .6 %
1 0 1 .0 %
100%
1992
1993
1994
1995
1996
1997
1998
1999
Operating Efficiency Ratio = General and Administrative Expense / Net Interest Income plus Fee Income.
Earnings Efficiency Ratio = Interest-Earning Assets / Interest-Bearing Liabilities.
1996 General and Administrative Expense excludes net SAIF special assessment.
Office of Thrift Supervision / March 2000
3
ADVERTISEMENT
0 votes
Related Articles
Related forms
 Profitability For Ots-regulated Private-sector Thrift Institutions Guide - Office Of Thrift Supervision - U.s. Department Of Treasury - 1998
Legal
Profitability For Ots-regulated Private-sector Thrift Institutions Guide - Office Of Thrift Supervision - U.s. Department Of Treasury - 1998
Legal
 U.s. Department Of Justice Form Eoir-29 - Notice Of Appeal To The Board Of Immigration - Appeals From A Decision Of A Uscis Officer
Legal
U.s. Department Of Justice Form Eoir-29 - Notice Of Appeal To The Board Of Immigration - Appeals From A Decision Of A Uscis Officer
Legal


 Form 1041 - Fiduciary Return Of Income For Calendar Year 1933 - U.s. Department Of Treasury
Financial
Form 1041 - Fiduciary Return Of Income For Calendar Year 1933 - U.s. Department Of Treasury
Financial
 Ref Cpi And Index Ratios For January 2000 - Treasury Inflation-indexed Securities - U.s. Department Of The Treasury, Bureau Of The Fiscal Service
Legal
Ref Cpi And Index Ratios For January 2000 - Treasury Inflation-indexed Securities - U.s. Department Of The Treasury, Bureau Of The Fiscal Service
Legal
 G-20: Fact Sheet On Imf Reform - Office Of The Press Secretary - The White House - U.s. Department Of The Treasury - 2010
Legal
G-20: Fact Sheet On Imf Reform - Office Of The Press Secretary - The White House - U.s. Department Of The Treasury - 2010
Legal

 - Treasury Inspector General For Tax Administration - U.s. Department Of The Treasury")
Related Categories
Parent category: Legal