Fourth Quarter 1999 Index Of Charts - Office Of Thrift Supervision - U.s. Department Of Treasury Page 11
ADVERTISEMENT
 1
1 2
2 3
3 4
4 5
5 6
6 7
7 8
8 9
9 10
10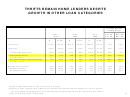 11
11 12
12 13
13 14
14 15
15 16
16 17
17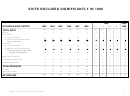 18
18THRIFTS REMAIN HOME LENDERS DESPITE
GROWTH IN OTHER LOAN CATEGORIES
Average Annual
Growth Rates
Dec '93
Dec '98
Dec
Dec
Dec
Dec '99
Dec '99
1993
1998
1999
$
% TA
$
% TA
$
% TA
Total Assets
$774.8
100.0%
$817.6
100.0%
$863.4
100.0%
1.9%
5.6%
Total Loans
503.8
65.0%
555.1
67.9%
583.6
67.6%
2.6%
5.1%
1-4 Family Mortgage Loans
354.8
45.8%
400.9
49.0%
408.0
47.3%
2.5%
1.8%
Construction Loans
12.7
1.6%
13.8
1.7%
17.6
2.0%
6.4%
27.6%
Other Mortgages
95.7
12.4%
77.5
9.5%
81.4
9.4%
-2.5%
5.1%
5.2
0.7%
15.6
1.9%
20.3
2.4%
48.5%
30.6%
Commercial Loans / Small Business
Consumer Loans
35.4
4.6%
47.4
5.8%
56.3
6.5%
9.9%
18.9%
Mortgage Pool Securities
119.5
15.4%
93.3
11.4%
94.8
11.0%
-3.5%
1.6%
Investment Securities
108.6
14.0%
113.8
13.9%
124.3
14.4%
2.4%
9.3%
Mortgage Derivatives
43.8
5.7%
67.1
8.2%
78.4
9.1%
13.2%
16.9%
Dollars in billions and numbers may not sum due to rounding.
Beginning in 1997, detailed asset categories are reported net of specific valuation allowances, loans-in-process,
and unamortized yield adjustments. This reporting change significantly reduced the construction loan balance.
Office of Thrift Supervision / March 2000
10
ADVERTISEMENT
0 votes
Related Articles
Related forms
 Profitability For Ots-regulated Private-sector Thrift Institutions Guide - Office Of Thrift Supervision - U.s. Department Of Treasury - 1998
Legal
Profitability For Ots-regulated Private-sector Thrift Institutions Guide - Office Of Thrift Supervision - U.s. Department Of Treasury - 1998
Legal
 U.s. Department Of Justice Form Eoir-29 - Notice Of Appeal To The Board Of Immigration - Appeals From A Decision Of A Uscis Officer
Legal
U.s. Department Of Justice Form Eoir-29 - Notice Of Appeal To The Board Of Immigration - Appeals From A Decision Of A Uscis Officer
Legal


 Form 1041 - Fiduciary Return Of Income For Calendar Year 1933 - U.s. Department Of Treasury
Financial
Form 1041 - Fiduciary Return Of Income For Calendar Year 1933 - U.s. Department Of Treasury
Financial
 Ref Cpi And Index Ratios For January 2000 - Treasury Inflation-indexed Securities - U.s. Department Of The Treasury, Bureau Of The Fiscal Service
Legal
Ref Cpi And Index Ratios For January 2000 - Treasury Inflation-indexed Securities - U.s. Department Of The Treasury, Bureau Of The Fiscal Service
Legal
 G-20: Fact Sheet On Imf Reform - Office Of The Press Secretary - The White House - U.s. Department Of The Treasury - 2010
Legal
G-20: Fact Sheet On Imf Reform - Office Of The Press Secretary - The White House - U.s. Department Of The Treasury - 2010
Legal

 - Treasury Inspector General For Tax Administration - U.s. Department Of The Treasury")
Related Categories
Parent category: Legal