Fourth Quarter 1999 Index Of Charts - Office Of Thrift Supervision - U.s. Department Of Treasury Page 2
ADVERTISEMENT
 1
1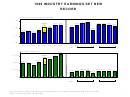 2
2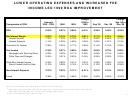 3
3 4
4 5
5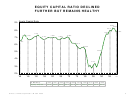 6
6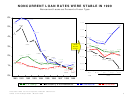 7
7 8
8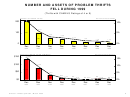 9
9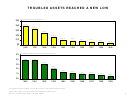 10
10 11
11 12
12 13
13 14
14 15
15 16
16 17
17 18
181999 INDUSTRY EARNINGS SET NEW
RECORD
Return on Average Assets (Annualized)
1.2%
1.13%
1.07%
1.00%
1.01%
0.98%
0.98%
Adjusted
0.97%
0.97%
0.93%
0.89%
0.87%
0.84%
0.8%
0.70%
0.69%
0.61% 0.63%
0.62%
0.56%
0.4%
0.0%
1992 1993 1994 1995 1996 1997 1998 1999
D e c
M a r
Jun
Sep
D e c
M a r
Jun
Sep
D e c
1997
1998
1999
Net Income ($ Millions)
$8,240
$7,569
Adjusted
$ 7,500
$6,802
$6,413
$5,360
$5,103
$4,917
$ 5,000
$ 4 , 7 4 0
$4,275
$ 2,500
$2,228
$2,095
$2,112
$2,061
$2,089
$1,867
$1,979
$1,659
$1,380
$ 0
1992
1993 1994
1995 1996
1997 1998
1999
Dec
M a r
J un
Sep
Dec
M a r
J un
Sep
Dec
1997
1998
1999
Adjusted data exclude the net SAIF special assessment of $2.1 billion incurred in the third quarter of 1996.
Office of Thrift Supervision / March 2000
1
ADVERTISEMENT
0 votes
Related Articles
Related forms
 Profitability For Ots-regulated Private-sector Thrift Institutions Guide - Office Of Thrift Supervision - U.s. Department Of Treasury - 1998
Legal
Profitability For Ots-regulated Private-sector Thrift Institutions Guide - Office Of Thrift Supervision - U.s. Department Of Treasury - 1998
Legal
 U.s. Department Of Justice Form Eoir-29 - Notice Of Appeal To The Board Of Immigration - Appeals From A Decision Of A Uscis Officer
Legal
U.s. Department Of Justice Form Eoir-29 - Notice Of Appeal To The Board Of Immigration - Appeals From A Decision Of A Uscis Officer
Legal


 Form 1041 - Fiduciary Return Of Income For Calendar Year 1933 - U.s. Department Of Treasury
Financial
Form 1041 - Fiduciary Return Of Income For Calendar Year 1933 - U.s. Department Of Treasury
Financial
 Ref Cpi And Index Ratios For January 2000 - Treasury Inflation-indexed Securities - U.s. Department Of The Treasury, Bureau Of The Fiscal Service
Legal
Ref Cpi And Index Ratios For January 2000 - Treasury Inflation-indexed Securities - U.s. Department Of The Treasury, Bureau Of The Fiscal Service
Legal
 G-20: Fact Sheet On Imf Reform - Office Of The Press Secretary - The White House - U.s. Department Of The Treasury - 2010
Legal
G-20: Fact Sheet On Imf Reform - Office Of The Press Secretary - The White House - U.s. Department Of The Treasury - 2010
Legal

 - Treasury Inspector General For Tax Administration - U.s. Department Of The Treasury")
Related Categories
Parent category: Legal