Fluid Visualization Of Spreadsheet Structures Page 3
ADVERTISEMENT
 1
1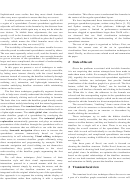 2
2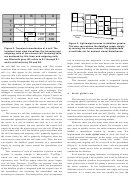 3
3 4
4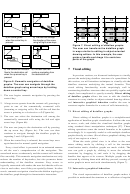 5
5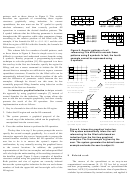 6
6 7
7 8
8A
B
C
D
0
1
10
20
30
40
2
3
100
100
200
Time
4
200
300
Figure 3. Lightweight access to dataflow graphs .
The user can explore the dataflow graph simply
Figure 2. Transient visualization of a cell . The
by moving the cursor around. The graphs fade
transient local view visualizes the incoming and
in and fade out for minimal visual disturbance.
outgoing cells of the current cell. Incoming cells
are enclosed by thin lines, and outgoing cells
are filled with gray. B3 refers to A1 through D1,
role in achieving this integration—it can smoothly present
and is referred to by D3 and D4.
larger visual structures as the user moves the cursor about
the spreadsheet. Without the fading animation and careful
the cell that the user is interacting with. The system
timing, constant flashing of the dataflow information would
visualizes both incoming cells (cells that affect the current
occur. In particular, when the dataflow graph is extensive, it
cell—i.e., that appear in the current cell’s formula) and
would be very distracting to see large graphs appear and
outgoing cells (cells that are affected by the current cell—i.e.,
disappear frequently.
cells that have formulas that the current cell appears in). The
This transient interaction mode is suspended during
system visually distinguishes the two kinds of cells by using
some operations, like editing, so that incidental movements
color, line thickness, or other graphical characteristics. Our
of the cursor will not cause unwanted visualizations.
implementation groups incoming cells into spatially adjacent
regions and encloses each region with a rectangle. The
4 Static global view
rectangle is connected to the current cell with a hairline,
while outgoing cells are filled with gray. Figure 2 shows an
example of a transient local view of a cell. Grouping
The transient local view has several advantages. It does
incoming cells makes use of both the logical structure of the
not require special operations, so the user’s focus can remain
spreadsheet (they are inputs to the current cell) and the
on the spreadsheet content as he simply moves the cursor
physical structure of the spreadsheet (they are adjacent in
around to invoke the local visualizations. It does not clutter
space).
the screen because it limits the presentation of the dataflow
The reason we call this technique transient lies in the
graph to that associated with one cell. Finally, the fading
manner in which the user specifies the current cell. In
transition effect helps the user to view the global structure of
conventional spreadsheet applications, the user must move
a spreadsheet in a pleasing, non-jarring manner.
the cursor to a cell of interest and click in it to see the
However, there are also many cases when the user may
formula. In our system, the user specifies the current cell
want to see the entire structure at once. For example, a user
simply by moving the mouse cursor over the cell. When the
may want to quickly review the entire structure when he is
cursor comes into a cell, the dataflow graph associated with
handed a spreadsheet created by another user. We
the cell (incoming and outgoing cells) gradually appears on
implemented the static global view to show this kind of
the screen (fades in), and it gradually disappears when the
overall structural information. In this mode, every dataflow
cursor moves away from the cell (fades out). Thus, the user
connection appears on the screen—this means every
can explore the dataflow graph structure of a spreadsheet
incoming and outgoing cell for every cell in the spreadsheet
simply by moving the cursor around the spreadsheet (see
(Figure 4). As in the transient local views, cells are presented
Figure 3).
as groups, which serves both to minimize clutter and to
This “mouseover” style of interaction is present in other
summarize the dataflow.
systems. A notable example is Microsoft’s “ToolTips,”
Even with the grouping technique, overlapping of many
which are tiny windows containing a few words of
portions of the graph is unavoidable, and it can be difficult to
explanatory text. ToolTips appear when the cursor lingers
follow the detailed dataflow for particular cells. Instead, the
over an item. However, ToolTips are separate from the
static global view is useful for getting a general overview of
annotated objects and overlay them, while our presentation
the entire structure. In our implementation, we assign
of the dataflow graph is integrated with the original view of
different colors for vertical, horizontal and single-cell group
the spreadsheet, not obscuring the spreadsheet and not
structures. As a result, the user can quickly see how the
becoming too obtrusive. The fading effect plays an important
ADVERTISEMENT
0 votes
Related Articles
Related forms
 Right Of Entry/hold Harmless Agreement/duplication Of Benefits Private Property Debris Removal & Demolition Of Unsafe Structures Form 2014
Legal
Right Of Entry/hold Harmless Agreement/duplication Of Benefits Private Property Debris Removal & Demolition Of Unsafe Structures Form 2014
Legal
 Right Of Entry/hold Harmless Agreement/duplication Of Benefits Private Property Debris Removal & Demolition Of Unsafe Structures Form
Business
Right Of Entry/hold Harmless Agreement/duplication Of Benefits Private Property Debris Removal & Demolition Of Unsafe Structures Form
Business


Related Categories
Parent category: Business