Dealer In Intangibles Tax Return - 2011 Page 14
ADVERTISEMENT
 1
1 2
2 3
3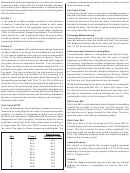 4
4 5
5 6
6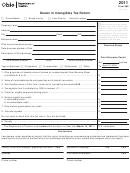 7
7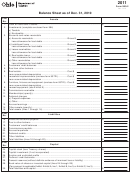 8
8 9
9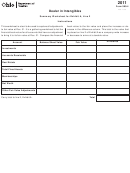 10
10 11
11 12
12 13
13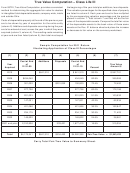 14
14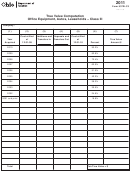 15
15 16
16 17
17 18
18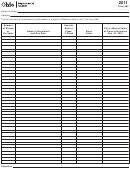 19
19 20
20True Value Computation – Class Life III
Form 937DI, True Value Computation, provides a consistent
the beginning of the year total plus additions, less disposals.
method for determining the aggregate fair value for dealers
The valuation percentages for the specifi ed class of property
in intangibles’ total depreciable assets, company-wide, inside
are listed in column 6. Each year-end cost is then multiplied
and outside Ohio.
by the corresponding valuation percentage and the product
placed in column 7. Total column 7 and that will be the fair
Costs of depreciable property at the end of the previous year
value of the depreciable assets. Compare the total fair value
are to be shown by year of acquisition for the entire entity
of the depreciable assets to the book value of those same
(column 2). Additions and disposals occurring during the year
assets on the Dec. 31 balance sheet and place the increase
are to be entered at cost, across the year in which they were
or decrease to fair value on the summary worksheet.
acquired (column 3, column 4). The resulting costs remaining
at year-end are then listed (column 5); their total must equal
Sample Computation for 2011 Return
Illustrating Application of Class III Percentages
(2)
(3)
(4)
(5)
(7)
(1)
(6)
Cost at End
Additions
Disposals
Cost at End
of
of
True Value
Year
12-31-09
12-31-10
Amount $
Acquired
Percent
2010
$641,310
$ 641,310
93.2%
$ 597,701
$434,040
434,040
359,385
2009
82.8%
301,032
$201,032
100,000
72,400
2008
72.4%
2007
277,736
277,736
62.0%
172,196
201,033
201,033
103,532
2006
51.5%
2005
147,001
147,001
42.2%
62,034
421,066
421,066
152,847
2004
36.3%
234,175
234,175
71,423
2003
30.5%
2002
148,622
148,622
24.6%
36,561
2,010,836
333,421
1,677,415
315,354
2001 and prior
18.8%
Fair/True Value = $1,943,433
$4,175,541
$641,310
$534,453
$4,282,398
Total
Carry Total Fair/True Value to Summary Sheet.
ADVERTISEMENT
0 votes
Related Articles
Related forms


Related Categories
Parent category: Financial