Grade 1 Curriculum Tracking Template Page 11
ADVERTISEMENT
 1
1 2
2 3
3 4
4 5
5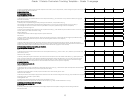 6
6 7
7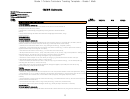 8
8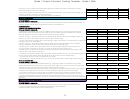 9
9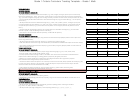 10
10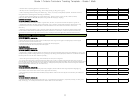 11
11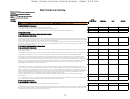 12
12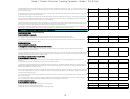 13
13 14
14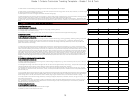 15
15 16
16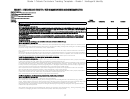 17
17 18
18 19
19 20
20 21
21 22
22 23
23 24
24 25
25 26
26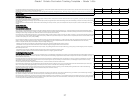 27
27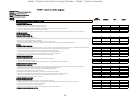 28
28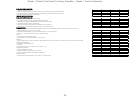 29
29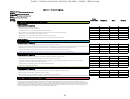 30
30 31
31Grade 1 Ontario Curriculum Tracking Template - Grade 1 Math
– describe numeric repeating patterns in a hundreds chart;
– identify a rule for a repeating pattern (e.g., “We’re lining up boy, girl, boy, girl, boy, girl.”);
– create a repeating pattern involving one attribute (e.g., colour, size, shape, sound) (Sample problem: Use beads to make a
string that shows a repeating pattern involving one attribute.);
– represent a given repeating pattern in a variety of ways (e.g., pictures, actions, colours, sounds, numbers, letters)
(Sample problem: Make an ABA,ABA,ABA pattern using actions like clapping or tapping.).
Expressions and Equality
By the end of Grade 1, students will:
– create a set in which the number of objects is greater than, less than, or equal to the number of objects in a given set;
– demonstrate examples of equality, through investigation, using a “balance” model (Sample problem: Demonstrate, using
a pan balance, that a train of 7 attached cubes on one side balances a train of 3 cubes and a train of 4 cubes on the
other side.);
– determine, through investigation using a “balance” model and whole numbers to 10, the number of identical objects that
must be added or subtracted to establish equality (Sample problem: On a pan balance, 5 cubes are placed on the left side
and 8 cubes are placed on the right side. How many cubes should you take off the right side so that both sides balance?).
Grade 1: Data Management and Probability
Overall Expectations
By the end of Grade 1, students will:
• collect and organize categorical primary data and display the data using concrete graphs and pictographs, without regard
to the order of labels on the horizontal axis;
• read and describe primary data presented in concrete graphs and pictographs;
• describe the likelihood that everyday events will happen.
Specific Expectations
Collection and Organization of Data
By the end of Grade 1, students will:
– demonstrate an ability to organize objects into categories by sorting and classifying objects using one attribute(e.g., colour, size),
and by describing informal sorting experiences (e.g., helping to put away groceries) (Sample problem: Sort a collection of attribute
blocks by colour. Re-sort the same collection by shape.);
– collect and organize primary data (e.g., data collected by the class) that is categorical
(i.e., that can be organized into categories based on qualities such as colour or hobby), and display the data using one-to-one
correspondence, prepared templates of concrete graphs and pictographs (with titles and labels), and a variety of recording methods
(e.g., arranging objects, placing stickers, drawing pictures, making tally marks) (Sample problem: Collect and organize data about
the favourite fruit that students in your class like to eat.).
Data Relationships
By the end of Grade 1, students will:
– read primary data presented in concrete graphs and pictographs, and describe the data using comparative language (e.g.,
more students chose summer than winter as their single favourite season);
– pose and answer questions about collected data (Sample problem: What was the most popular fruit chosen by the students in
your class?).
Probability
By the end of Grade 1, students will:
– describe the likelihood that everyday events will occur, using mathematical language(i.e., impossible, unlikely, less likely, more
likely, certain) (e.g.,“It’s unlikely that I will win the contest shown on the cereal box.”).
11
ADVERTISEMENT
0 votes
Related Articles
Related forms

 Template")


")


Related Categories
Parent category: Business