Ratios And Rates Worksheet - Chapter 3 Page 28
ADVERTISEMENT
 1
1 2
2 3
3 4
4 5
5 6
6 7
7 8
8 9
9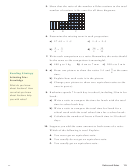 10
10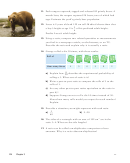 11
11 12
12 13
13 14
14 15
15 16
16 17
17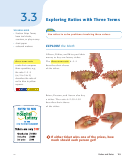 18
18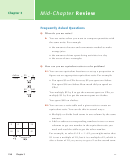 19
19 20
20 21
21 22
22 23
23 24
24 25
25 26
26 27
27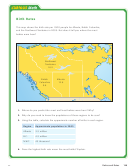 28
28 29
29 30
30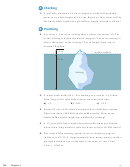 31
31 32
32 33
33 34
34 35
35 36
36 37
37 38
38Birth Rates
This map shows the birth rate per 1000 people for Alberta, British Columbia,
and the Northwest Territories in 2005. But does it tell you where the most
babies were born?
Northwest
Territories
16.2
British
Alberta
Columbia
12.6
9.6
1. Where do you predict the most and least babies were born? Why?
2. Why do you need to know the populations of those regions to be sure?
3. Using the table, calculate the approximate number of births in each region.
Region
Approximate population in 2005
Alberta
3.3 million
B.C.
4.3 million
N.W.T.
43 thousand
4. Does the highest birth rate mean the most births? Explain.
129
Ratios and Rates
NEL
ADVERTISEMENT
0 votes
Related Articles
Related forms


Related Categories
Parent category: Education