Pie Chart Worksheet Page 3
ADVERTISEMENT
 1
1 2
2 3
3 4
4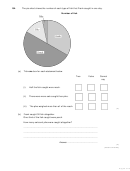 5
5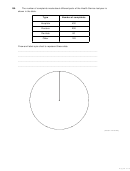 6
6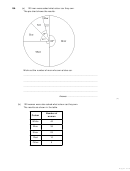 7
7 8
8 9
9 10
10 11
11 12
12 13
13(c)
The pupils in the obstacle race took these times in seconds.
23
36
18
29
44
39
36
54
43
41
Draw an ordered stem and leaf diagram to show this information.
.........................................................................................................................
.........................................................................................................................
.........................................................................................................................
.........................................................................................................................
.........................................................................................................................
Key:
|
2
| 3
represents 23 seconds
(3)
(Total 9 marks)
Q3.
(a)
The pie chart shows the ways that 30 pupils travel to school.
Page 3 of 13
ADVERTISEMENT
0 votes
Related Articles
Related forms


Related Categories
Parent category: Education