Pie Chart Worksheet Page 5
ADVERTISEMENT
 1
1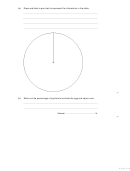 2
2 3
3 4
4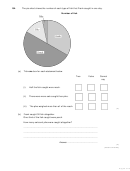 5
5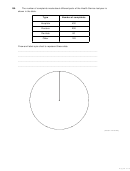 6
6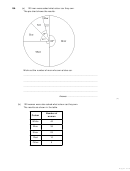 7
7 8
8 9
9 10
10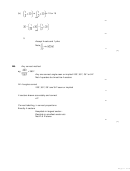 11
11 12
12 13
13Q4.
The pie chart shows the number of each type of fish that Frank caught in one day.
Number of fish
(a)
Tick one box for each statement below.
True
False
Cannot
say
(i)
Half the fish caught were roach.
(ii)
There were more eels caught than pike.
(iii)
The pike weighed more than all of the roach.
(3)
(b)
Frank caught 30 fish altogether.
One-third of the fish caught were perch.
How many eels and pike were caught altogether?
.........................................................................................................................
.........................................................................................................................
.........................................................................................................................
Answer .................................................
(3)
(Total 6 marks)
Page 5 of 13
ADVERTISEMENT
0 votes
Related Articles
Related forms


Related Categories
Parent category: Education