Pie Chart Worksheet Page 4
ADVERTISEMENT
 1
1 2
2 3
3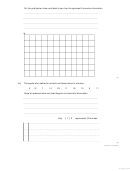 4
4 5
5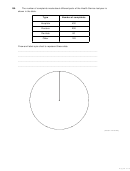 6
6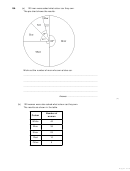 7
7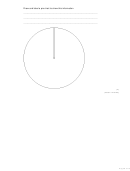 8
8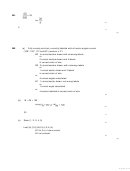 9
9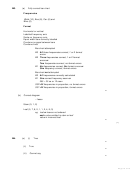 10
10 11
11 12
12 13
13On the grid below, draw and label a bar chart to represent the same information.
.........................................................................................................................
.........................................................................................................................
.........................................................................................................................
.........................................................................................................................
(4)
(b)
The pupils who walked to school took these times in minutes.
5
12
7
14
23
11
18
10
8
11
Draw an ordered stem and leaf diagram to show this information.
.........................................................................................................................
.........................................................................................................................
.........................................................................................................................
.........................................................................................................................
Key:
│ 1 │ 2
represents 12 minutes
(3)
(Total 7 marks)
Page 4 of 13
ADVERTISEMENT
0 votes
Related Articles
Related forms


Related Categories
Parent category: Education