Bar Charts And Pie Charts Worksheet Page 11
ADVERTISEMENT
 1
1 2
2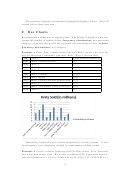 3
3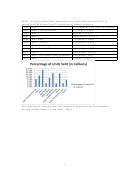 4
4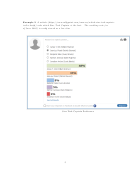 5
5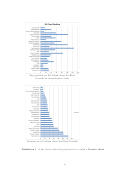 6
6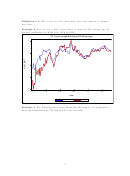 7
7 8
8 9
9 10
10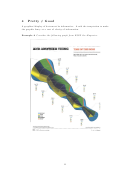 11
11 12
12 13
134
Pretty 6 = Good
A graphical display of data must be informative. Avoid the temptation to make
the graphic fancy at a cost of clarity of information.
Example 8 Consider the following graph from ESPN the Magazine.
11
ADVERTISEMENT
0 votes
Related Articles
Related forms


Related Categories
Parent category: Education