Bar Charts And Pie Charts Worksheet Page 7
ADVERTISEMENT
 1
1 2
2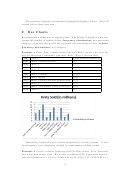 3
3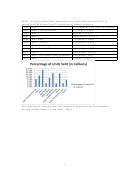 4
4 5
5 6
6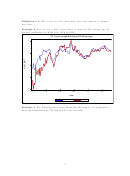 7
7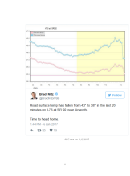 8
8 9
9 10
10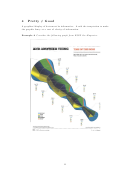 11
11 12
12 13
13De…nition 2 A time series is a bar chart that represents data as it changes
over time.
Example 4 Here we use a time series chart to represent the average age of
pitchers and batters in MLB from 1876 to 2016.
All Time Average Batting and Pitching Ages
30
28
26
24
22
1875
1900
1925
1950
1975
2000
Year
A VG_BA T
A VG_P
Example 5 The following time series documents the drop in air temperature
and road temperature at I-75 and GA-92 near Acworth.
7
ADVERTISEMENT
0 votes
Related Articles
Related forms


Related Categories
Parent category: Education