Colorado Income Tax Filing Guide - 2013 Page 26
Download a blank fillable Colorado Income Tax Filing Guide - 2013 in PDF format just by clicking the "DOWNLOAD PDF" button.
Open the file in any PDF-viewing software. Adobe Reader or any alternative for Windows or MacOS are required to access and complete fillable content.
Complete Colorado Income Tax Filing Guide - 2013 with your personal data - all interactive fields are highlighted in places where you should type, access drop-down lists or select multiple-choice options.
Some fillable PDF-files have the option of saving the completed form that contains your own data for later use or sending it out straight away.
ADVERTISEMENT
 1
1 2
2 3
3 4
4 5
5 6
6 7
7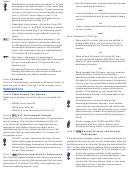 8
8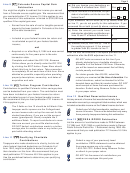 9
9 10
10 11
11 12
12 13
13 14
14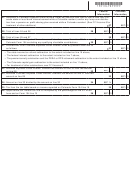 15
15 16
16 17
17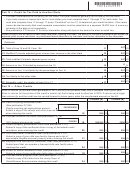 18
18 19
19 20
20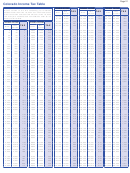 21
21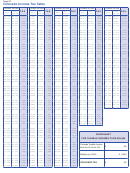 22
22 23
23 24
24 25
25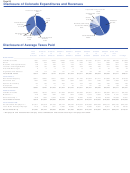 26
26 27
27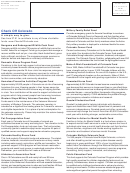 28
28Page 26
Disclosure of Colorado Expenditures and Revenues
Expenditures by Function
Revenues by Source
Other
Other
Transportation
9.4%
2.8%
4.8%
Justice
Taxes
6.9%
40.7%
Educatio
n
41.6%
Federal Grants &
Business, Community
Contracts
& Consumer Affairs
31.7%
8.5%
Interest & Rents
1.5%
Licenses Permits
Social Assistance
Charges for Goods &
& Fines
28.9%
Services
3.6%
19.6%
Disclosure of Average Taxes Paid
Fiscal Year 2011
Adjusted Family Money Income
Less
$10,000
$15,000
$20,000
$30,000
$40,000
$50,000
$70,000
$80,000
$100,000
than
to
to
to
to
to
to
to
to
and
$10,000
$15,000
$20,000
$30,000
$40,000
$50,000
$70,000
$80,000
$100,000
over
Average
State Taxes:
________________________________________________________________________________________________________________
Individual Income
$50
$104
$229
$438
$745
$1,098
$1,530
$1,941
$2,498
$6,245
$1,969
Sales
128
154
205
255
319
349
407
411
585
933
434
Gasoline and Special Fuels
68
94
122
151
178
201
224
159
258
301
192
Licenses and Registrations
39
55
88
94
109
134
143
125
177
252
136
Alcoholic Beverages
3
3
4
6
9
9
13
10
16
25
12
Cigarettes and Tobacco
48
57
63
67
74
80
79
38
74
55
64
Total State Taxes
$337
$467
$712
$1,012
$1,434
$1,871
$2,396
$2,684
$3,608
$7,811
$2,807
Local Taxes:
Residential Property
$321
$405
$761
$937
$1,025
$1,125
$1,604
$1,721
$1,866
$3,144
$1,483
Sales and Use
202
242
323
402
502
550
641
646
922
1,469
684
Specific Ownership
44
68
112
105
127
154
159
120
195
239
145
Occupation
2
5
7
11
16
21
27
33
40
59
26
Total Local Taxes
$568
$720
$1,203
$1,454
$1,670
$1,851
$2,431
$2,520
$3,023
$4,911
$2,337
Federal Taxes:
Individual Income
$446
$619
$913
$1,408
$2,264
$3,358
$4,961
$6,451
$8,382
$31,771
$8,708
Medicare **
122
282
432
635
924
1,228
1,573
1,905
2,345
4,137
1,634
Social Security **
428
993
1,523
2,236
3,255
4,326
5,538
6,708
8,256
12,099
5,267
Total Federal Taxes
$995
$1,894
$2,868
$4,278
$6,443
$8,912
$12,072
$15,065
$18,983
$48,008
$15,608
Total Taxes Paid
Households & Employers **
$1,901
$3,082
$4,783
$6,744
$9,548
$12,634
$16,899
$20,268
$25,615
$60,730
$20,752
Less Taxes Paid by Employer
275
638
977
1,435
2,090
2,777
3,556
4,307
5,301
8,118
3,450
Households Only
$1,626
$2,444
$3,805
$5,309
$7,458
$9,857
$13,343
$15,962
$20,314
$52,612
$17,302
** Employers and households both pay taxes to Medicare and Social Security on employees’ behalf.
ADVERTISEMENT
0 votes
Related Articles
Related forms


Related Categories
Parent category: Financial