Grade Three Indicators For The 2003 Mathematics Standard Course Of Study Page 19
ADVERTISEMENT
 1
1 2
2 3
3 4
4 5
5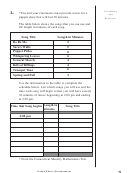 6
6 7
7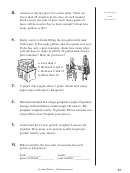 8
8 9
9 10
10 11
11 12
12 13
13 14
14 15
15 16
16 17
17 18
18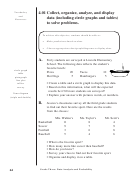 19
19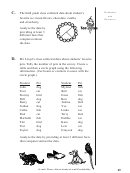 20
20 21
21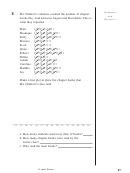 22
22 23
23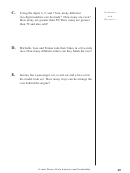 24
24 25
25 26
26 27
27 28
28 29
29 30
30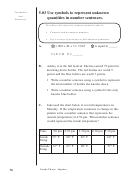 31
31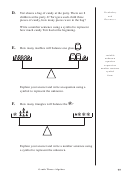 32
32 33
33 34
34Vocabulary
4.01 Collect, organize, analyze, and display
and
data (including circle graphs and tables)
Resources
to solve problems.
To achieve this objective, students should be able to:
•
Make predictions based on data.
•
Choose appropriate chart/graph/diagrams to display data.
A.
Forty students are surveyed at Lincoln Elementary
School. The following data reflects the student’s
favorite lunch:
circle graph
Pizza
20
Tacos
10
table
Hot Dogs
5
Hamburgers
5
pictograph
line plot
• Create a table and a circle graph to display this data.
tallies
survey
• Based on this information, what will the expected
results be if 80 more students are surveyed?
Venn diagram
• Explain your answer with pictures words, or numbers.
(triple and double)
B.
Jessica’s classmates survey all the third grade students
to find out their favorite sport. Here are the results
from the classes:
Mrs. Walton’s
Ms. Taylor’s
Mr. Scott’s
Basketball
11
8
4
Soccer
9
7
9
Football
3
6
8
Baseball
5
4
6
• What is the favorite sport?
• How many more like soccer then baseball?
• How do you know?
• Survey your class to find out their favorite sport.
• Organize and display it on a table.
Grade Three:
Data Analysis and Probability
64
ADVERTISEMENT
0 votes
Related Articles
Related forms

 World Book Typical Course Of Study Curriculum Guide For Preschool Template - Lowcountry Homeschool Association
Business
World Book Typical Course Of Study Curriculum Guide For Preschool Template - Lowcountry Homeschool Association
Business
 Lowcountry Homeschool Association - Template Course Of Study Curriculum Guide For Kindergarten
Business
Lowcountry Homeschool Association - Template Course Of Study Curriculum Guide For Kindergarten
Business


Related Categories
Parent category: Education