2.1 Tally Charts And Frequency Tables Worksheet Page 13
ADVERTISEMENT
 1
1 2
2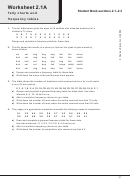 3
3 4
4 5
5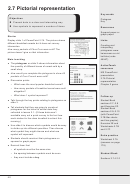 6
6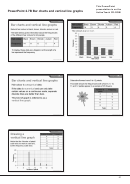 7
7 8
8 9
9 10
10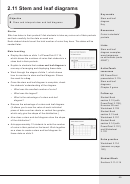 11
11 12
12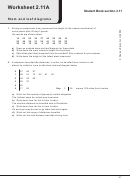 13
13 14
14 15
15 16
16 17
17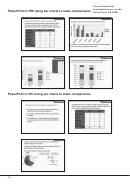 18
18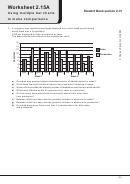 19
19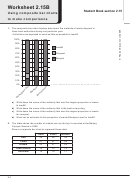 20
20 21
21 22
22 23
23 24
24 25
25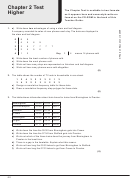 26
26 27
27Worksheet 2.11A
Student Book section 2.11
Stem and leaf diagrams
1.
During an experiment a boy measured the height (to the nearest centimetre) of
some plants after 30 days’ growth.
His results are shown below.
15
23
25
34
37
45
59
36
19
22
36
35
31
24
41
37
24
23
36
35
18
26
0
47
38
31
32
a)
Draw an ordered stem and leaf diagram for these data.
b)
Write down the most common height for the plants.
c)
Should the plant that measured 0 cm be included? Give a reason for your answer.
d)
Write down the height of the tallest plant measured.
2.
A salesman recorded the distances, in miles, he travelled from London to the
places he visited in June on the stem and leaf diagram below.
0
27
66
97
1
28
51
74
84
91
93
2
04
26
65
3
05
97
4
82
5
17
60
Key
1
28
means 128 miles from London
a)
Work out the number of places he visited altogether.
The furthest place he visited was Inverness.
b)
Write down how far this is from London.
The shortest distance he travelled was to Rochester.
c)
Write down how far this is from London.
On every journey he has to go there and back again.
d)
Work out the range of distances travelled.
e)
Work out the total distance travelled during June.
47
ADVERTISEMENT
0 votes
Related Articles
Related forms


 - 1ma0 Frequency Tables Worksheet - Edexcel Gcse")


Related Categories
Parent category: Education